present
Daftar dan dapatkan potongan bernilai $50 untuk pembelian pertama anda
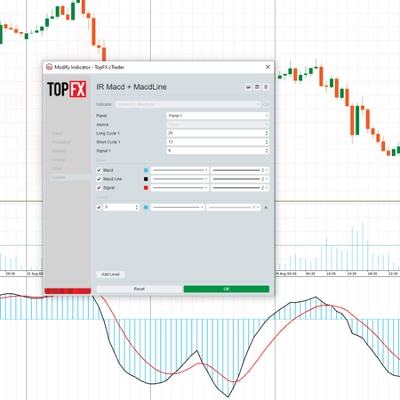
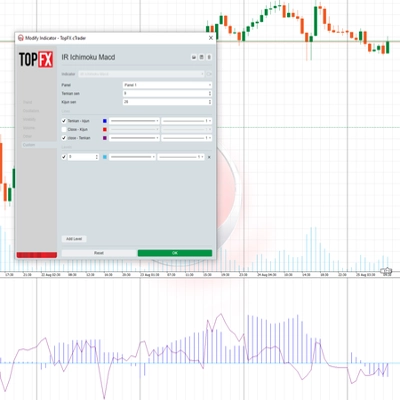
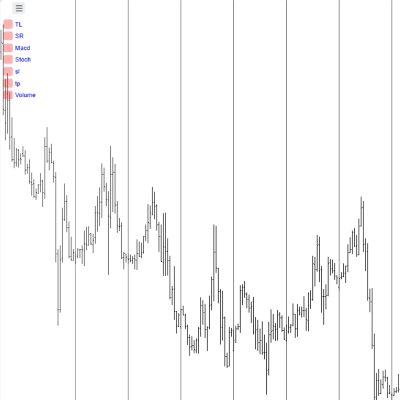
Trading product for IR Macd on Chart Indikator MACD, image 1
IR Macd on Chart
5.0
Ulasan: 1
5.66K
Pemasangan percuma

Penerangan

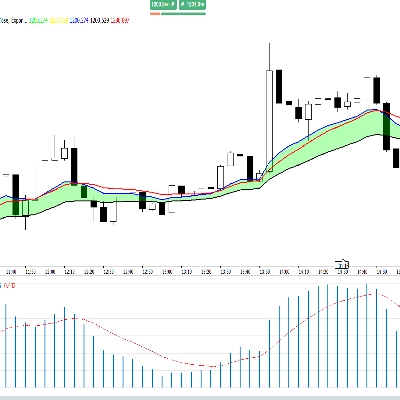
penunjuk ini menunjukkan macd pada carta.

Ringkasan

Ringkasan AI
IR Macd on Chart is a trading indicator that displays the Moving Average Convergence Divergence (MACD) directly on the price chart. It provides a visual representation of the MACD, a momentum indicator used to identify trend direction and potential reversals by showing the relationship between two moving averages of a security’s price. This indicator integrates the MACD histogram and signal line within the chart interface, enabling traders to analyze momentum without switching views. It supports standard MACD functionality and is categorized under momentum indicators.
Profil indikator

Perbincangan

Ulasan pelanggan

5.0
Ulasan: 1
5
100 %
4
0 %
3
0 %
2
0 %
1
0 %
Ulasan pelanggan
April 15, 2025
ok

Soalan Lazim

MACD
Produk yang tersedia melalui cTrader Store, termasuk bot dagangan, indikator dan plugin, disediakan oleh pembangun pihak ketiga dan diberikan akses untuk tujuan maklumat dan teknikal sahaja. cTrader Store bukan broker dan tidak memberikan nasihat pelaburan, syor peribadi atau sebarang jaminan prestasi masa hadapan.

Lebih banyak produk daripada penulis ini
Logo "IR Candle MTF"
4.6
(6)
Percuma
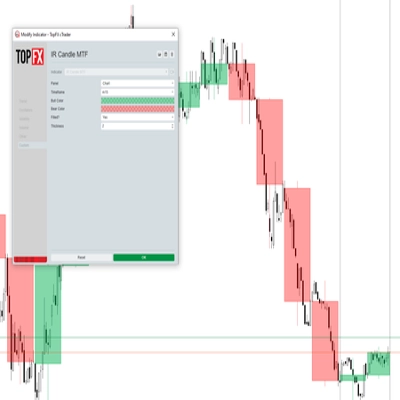
with this indicator you could see other time frame candle in your chart.
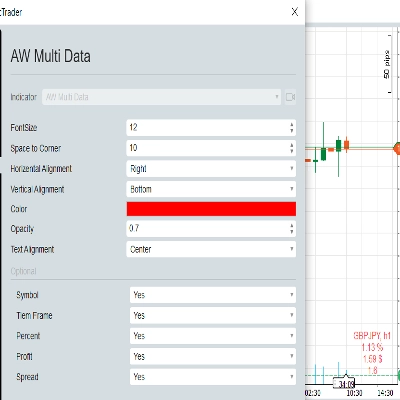
show spread on chart
some user add moving average to macd to see better. in ctrader 4.3.11 there is a problem with this . I make a macd tha
Multi Time Frame Moving Average is a powerful and flexible indicator for cTrader
 this moving include everything that a trader needs from Moving Average.
this indicaotr show distance between Tenkan to Kijun, Close to Kijun and Close to Tenkan 
Add Slowing to IR Moving Average.
IR Candle Open plots customizable opening price lines for daily, weekly, and monthly candles
Coral indicator
you could put your check list in your chart you could split your test with “,” you could put your checklist in indicat
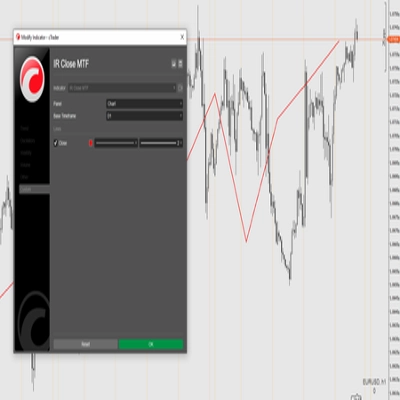
this indicator show other time frame close in lower time frame. for ex: show daily close in m 15.
don't move to the end of chart after timeframe changing. it should be better to use for near history. for long history

Anda juga mungkin suka

Institutional Flow Radar scans the chart for abnormal volume events and classifies them into two groups: Capital &Public
Map market structure, order blocks, liquidity and key zones with an interactive cTrader dashboard.
BB20 MULTICOLOR
📊Predicts price movement by combining multi-timeframe trend analysis, market volatility 📉, and..
Logo "VA Footprint"
4.5
(4)
dari $19
VA Footprint replaces your chart with a order flow one, the most precise way to read the market.
DMX Hull transforms complex directional movement data into a fluid visual tool.
Advanced Dual KAMA indicator with automated multi-asset presets & target levels.
Volume profile key levels - POC, value area, volume peaks and troughs - with break, rejection and retest signals
Logo "VWAP_MTF"
4.5
(4)
$19
/
$30
📊 VWAP with MTF & Dynamic Deviation Bands
VWAP Bands indicator with 3 standard deviation levels, buy/sell zones, and a draggable ON/OFF button to toggle the entir
This trading game allows you to explore and practice investment strategies in a real-time market data environment.
Market structure signals graded A to C, each with a drawn trade plan, plus an adaptive trend ribbon and a trend matrix
Logo "Stochastic RSI PRO"
4.6
(6)
$28
/
$40
Unlock Stochastic RSI PRO in cTrader! Overlay RSI, highlight zones, and identify divergences with customizable settings.
Unique Pyramid Design , Clear Price Action Trend
Delta Peak Bubbles is a tick‑chart overlay for cTrader that highlights the strongest momentum spikes.
Most used candle patterns. (1 candle, 2 candles and 3 candles patterns) and Marubozu. Bonus Fibo Risk control.
MA Quant Adaptive Price Zone Oscillator identifie dynamiquement les zones de prix optimales pour les entrées et sorties.
A cutting‑edge trading indicator that fuses AI and mathematics with adaptive logic to classify market regimes.

Harga

5.66K
Pemasangan percuma