
Penerangan
Buka pemahaman yang lebih mendalam tentang dinamik pasaran Forex dengan penunjuk Kekuatan Mata Wang Relatif (RCS) yang komprehensif, direka khusus untuk platform cTrader.
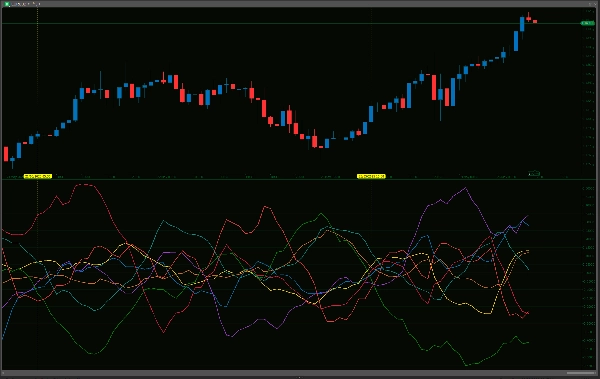
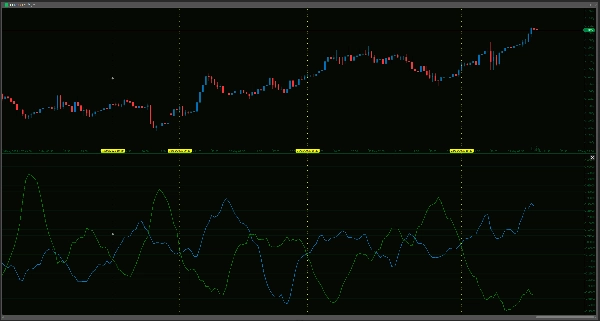
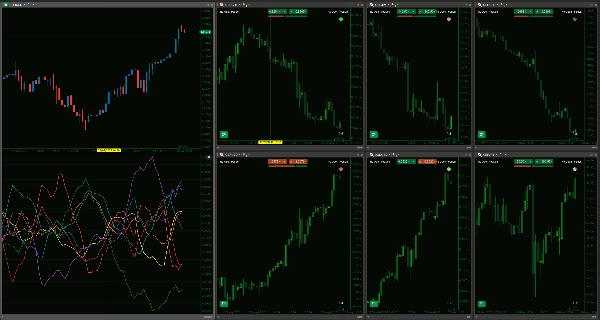
Alat yang kuat ini menilai dengan teliti prestasi individu lapan mata wang utama—AUD, USD, EUR, JPY, GBP, CAD, CHF, dan NZD—dengan menganalisis perubahan peratusan mereka antara satu sama lain merentasi bakul 28 pasangan mata wang. Dengan tempoh lookback dan pelicinan yang ditetapkan pengguna, anda boleh melaras kepekaan penunjuk untuk disesuaikan dengan pendekatan dagangan unik anda, daripada scalping pantas hingga strategi jangka panjang. Output visual yang jelas membolehkan perbandingan segera, membantu anda mengenal pasti dengan cepat mata wang yang menunjukkan momentum menaik yang kuat atau yang menunjukkan tanda kelemahan, yang boleh menjadi penting dalam memilih pasangan mata wang dengan potensi lebih tinggi untuk strategi anda. Ia menawarkan cara untuk bergerak melepasi analisis pasangan tunggal dan melihat gambaran besar mata wang individu yang benar-benar memacu pergerakan pasaran.
Walau bagaimanapun, adalah penting untuk menggunakan penunjuk ini dengan pemahaman yang jelas tentang keupayaan dan batasannya. Penunjuk RCS adalah alat analitik yang canggih, bukan peranti ramalan yang tidak boleh silap atau sistem dagangan 'set-and-forget' lengkap dengan sendirinya. Pengiraannya berasaskan data harga sejarah dan bertujuan untuk menambah, bukan menggantikan, metodologi dagangan anda yang telah ditetapkan, yang harus sentiasa merangkumi analisis tindakan harga yang teliti, pertimbangan faktor asas, dan amalan pengurusan risiko yang kukuh. Walaupun 'kekuatan' atau 'kelemahan' ditonjolkan oleh garis, bacaan ini memerlukan tafsiran yang berhati-hati dalam konteks pasaran yang lebih luas; contohnya, mata wang yang menunjukkan 'kekuatan' yang melampau mungkin menghampiri keadaan terlebih beli atau tahap rintangan utama.
Prestasi penunjuk juga boleh berubah mengikut keadaan pasaran semasa (contohnya, ia mungkin berkelakuan berbeza dalam pasaran yang sangat trending berbanding pasaran yang bergerak sisi dan tidak menentu), dan ketepatannya bergantung pada platform anda mempunyai data sejarah yang mencukupi dan bersih untuk semua 28 pasangan mata wang yang terlibat. Walaupun dioptimumkan untuk pengiraan berterusan, pemuatan data awal untuk analisis silang mata wang yang komprehensif seperti ini boleh membebankan sumber platform, terutamanya pada sambungan yang lebih perlahan atau perkakasan yang kurang berkuasa. Dengan menyediakan perspektif multi-mata wang yang bernuansa, penunjuk RCS ini ditawarkan sebagai bantuan berharga untuk membantu anda membuat keputusan dagangan yang lebih bermaklumat dan strategik serta berpotensi meningkatkan kelebihan anda dalam arena Forex yang kompetitif, bukannya sebagai penyelesaian berdiri sendiri.
Sila pastikan broker anda menawarkan semua pasangan silang dalam penunjuk ini supaya ia berfungsi.
--------------------------
Sila jangan teragak-agak untuk melihat penunjuk saya yang lain!
https://ctrader.com/products/1181
https://ctrader.com/products/1182
https://ctrader.com/products/1180
https://ctrader.com/products/1015
https://ctrader.com/products/555
https://ctrader.com/products/553
https://ctrader.com/products/554
https://ctrader.com/products/552
https://ctrader.com/products/557
https://ctrader.com/products/845
https://ctrader.com/products/848
https://ctrader.com/products/847
https://ctrader.com/products/846
https://ctrader.com/products/551
https://ctrader.com/products/574
https://ctrader.com/products/573
https://ctrader.com/products/556
https://ctrader.com/products/558
https://ctrader.com/products/559
https://ctrader.com/products/560
Ringkasan
The indicator provides a clear visual representation of currency strength and weakness, enabling traders to identify currencies with strong momentum or signs of weakness at a glance. This multi-currency perspective helps move beyond single-pair analysis to understand which currencies are driving market movements.
The tool relies on historical price data and requires all relevant currency pairs to be available from the broker. Its performance may vary with market conditions, and it is intended to complement, not replace, comprehensive trading strategies that include price action, fundamental analysis, and risk management. Initial data loading can be resource-intensive due to the breadth of cross-currency calculations.
This indicator serves as an analytical aid to support more informed Forex trading decisions by highlighting relative currency strength across major pairs.
Ulasan pelanggan
5 | 33 % | |
4 | 67 % | |
3 | 0 % | |
2 | 0 % | |
1 | 0 % |


