
Deskripsi
https://chartshots.spotware.com/c/695be69b1a3ca
https://chartshots.spotware.com/c/695be2a98e848
https://chartshots.spotware.com/c/695be7e8e88fa
https://chartshots.spotware.com/c/695be31346fe7
https://chartshots.spotware.com/c/695be3bd18aea
https://chartshots.spotware.com/c/695be5d5687c7
Pola Grafik Otomatis
📊 APA ITU?
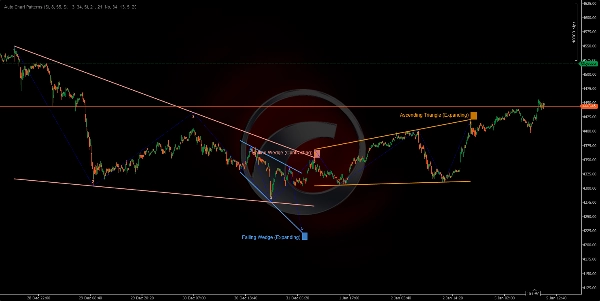
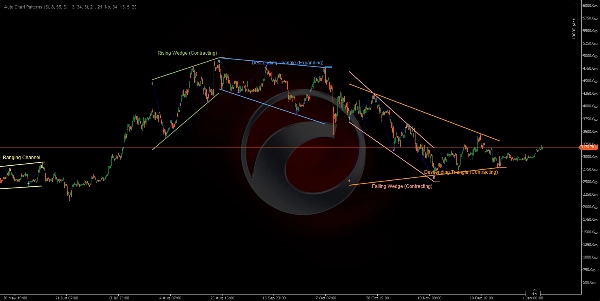
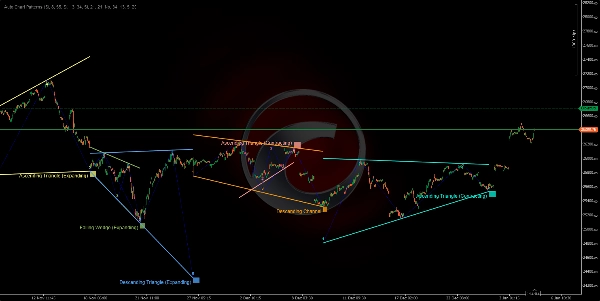
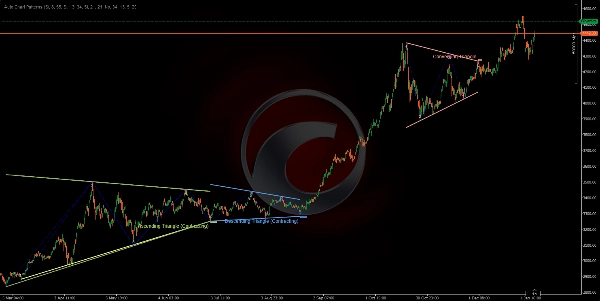
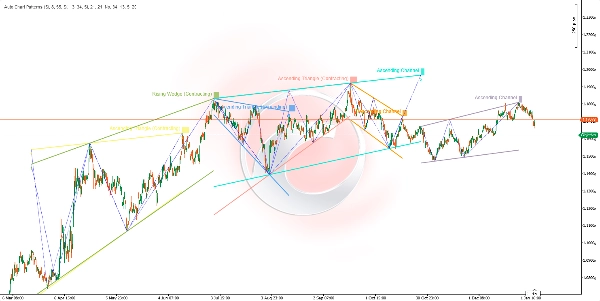
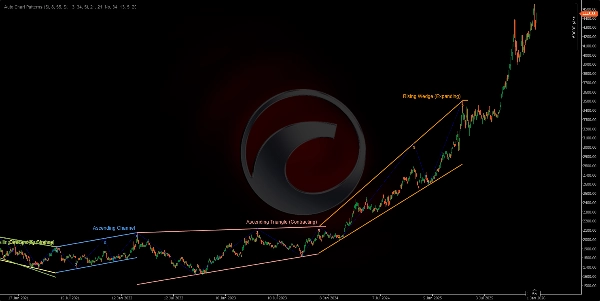
Indikator Pola Grafik Otomatis adalah pemindai formasi geometris canggih yang secara otomatis mendeteksi dan memvisualisasikan pola grafik klasik menggunakan analisis titik ayunan multi-timeframe. Ini mengidentifikasi 14 formasi geometris berbeda termasuk saluran, baji, dan segitiga dengan menghubungkan titik ayunan tertinggi dan terendah dengan garis tren, menciptakan sistem pengenalan pola yang komprehensif.
🎯 UNTUK APA?
Indikator ini membantu trader untuk:
- Secara otomatis mendeteksi 14 pola grafik klasik (saluran, baji, segitiga) 📐
- Mengidentifikasi zona breakout potensial sebelum terjadi ⚡
- Memvisualisasikan struktur pasar melalui hubungan harga geometris 🔍
- Melakukan perdagangan pola kelanjutan dan pembalikan dengan konfirmasi visual ✅
- Menyaring pola berdasarkan arah tren dan tipe pivot akhir 🎛️
- Menganalisis beberapa timeframe ayunan secara bersamaan untuk konfluensi 🌊
🔍 BAGAIMANA CARA KERJANYA?
Sistem Deteksi Titik Ayunan 📍
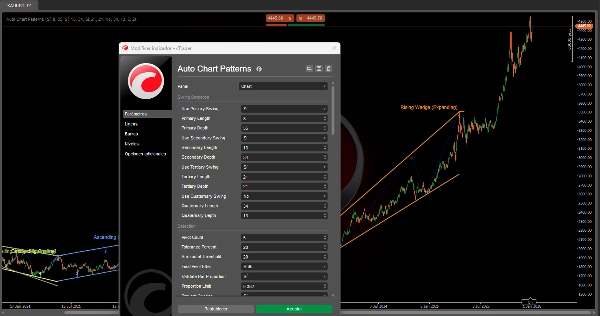
Indikator menggunakan hingga empat detektor ayunan independen yang berjalan bersamaan, masing-masing dengan sensitivitas yang dapat dikonfigurasi:
- Logika Deteksi:
-
- Memantau harga tertinggi dan terendah selama jendela bergulir (Periode).
- Mengidentifikasi puncak lokal (ayunan tinggi) dan lembah (ayunan rendah).
- Mengonfirmasi ayunan hanya setelah persyaratan kedalaman minimum terpenuhi (mencegah noise).
- Ayunan Tinggi: Harga membuat titik tertinggi dalam Periode, kemudian turun selama
MinDepthbar. - Ayunan Rendah: Harga membuat titik terendah dalam Periode, kemudian naik selama
MinDepthbar.
- Empat Lapisan Ayunan:
-
- Ayunan Primer (Default: Panjang 8, Kedalaman 55) - Struktur jangka panjang 🔵
- Ayunan Sekunder (Default: Panjang 13, Kedalaman 34) - Struktur jangka menengah 🟢
- Ayunan Tersier (Default: Panjang 21, Kedalaman 21) - Struktur jangka pendek 🟡
- Ayunan Kuarterner (Default: Nonaktif) - Timeframe khusus 🟣
Setiap detektor dapat diaktifkan/dinonaktifkan secara independen untuk fokus pada struktur pasar tertentu.
Proses Pembentukan Pola 🎨
LANGKAH 1 - PENGUMPULAN PIVOT:
- Sistem mengumpulkan 5 atau 6 titik ayunan terbaru dari detektor aktif mana pun.
- Titik harus bergantian antara tinggi dan rendah (struktur zigzag).
- Contoh 5-titik: Tinggi → Rendah → Tinggi → Rendah → Tinggi.
LANGKAH 2 - KONSTRUKSI GARIS TREN:
- Memisahkan pivot menjadi titik atas (ayunan tinggi) dan titik bawah (ayunan rendah).
- Menggambar dua garis tren: batas atas dan batas bawah.
- Untuk batas 3-titik: Menguji 3 kombinasi (0-2, 0-1, 1-2) dan memilih yang terbaik ⭐
- Memvalidasi bahwa garis tren tidak menembus badan lilin (hanya sumbu yang diperbolehkan).
- Menghitung skor kecocokan: garis harus menyentuh < 20% bar antara pivot.
LANGKAH 3 - ANALISIS GEOMETRIS:
- Mengukur hubungan sudut antara batas atas dan bawah.
- Menentukan apakah formasi Melebar (mengembang), Mengecil (menyempit), atau Paralel (lebar konstan).
- Mengidentifikasi arah tren: Naik, Turun, atau Netral (horizontal).
- Mengklasifikasikan ke dalam salah satu dari 14 tipe formasi berdasarkan geometri.
LANGKAH 4 - VALIDASI & PENYARINGAN:
- Pemeriksaan Proporsi Bar: Memastikan jarak ayunan proporsional (mencegah pola terdistorsi) ✅
- Pencegahan Tumpang Tindih: Memblokir pola baru yang bertentangan dengan yang sudah ada 🚫
- Pemeriksaan Duplikat: Mencegah penggambaran ulang pola yang sama.
- Filter Pivot Akhir: Hanya menampilkan pola yang berakhir dengan arah pivot tertentu (Naik/Turun/Keduanya).
- Filter Tipe Formasi: Mengaktifkan/nonaktifkan kategori pola tertentu.
LANGKAH 5 - VISUALISASI:
- Menggambar garis batas atas dan bawah dengan warna cerah dari palet 12 warna 🎨
- Opsional menampilkan garis ayunan zigzag yang menghubungkan pivot (bergaris putus-putus biru).
- Menampilkan nomor pivot (1, 2, 3, 4, 5) di setiap titik ayunan.
- Memberi label formasi dengan nama pola pada pivot akhir.
- Memberi kode warna latar belakang di belakang label untuk kejelasan.
📐 14 FORMASI YANG TERDETEKSI
SALURAN (Formasi Paralel) 📦
- Saluran Naik (Paralel Naik) 📈
-
- Kedua batas miring ke atas dengan sudut yang serupa.
- Menunjukkan tren kelanjutan bullish.
- Perdagangan: Beli di batas bawah, jual di batas atas.
- Saluran Turun (Paralel Turun) 📉
-
- Kedua batas miring ke bawah dengan sudut yang serupa.
- Menunjukkan tren kelanjutan bearish.
- Perdagangan: Jual di batas atas, beli di batas bawah.
- Saluran Mendatar (Lateral/Horisontal) ↔️
-
- Kedua batas hampir horizontal.
- Menunjukkan konsolidasi atau ketidakpastian.
- Perdagangan: Strategi rentang, beli di support/jual di resistance.
BAJI MENGEMBANG (Formasi Melebar) 📣
4. Baji Naik (Mengembang) ⚠️
* Kedua batas miring ke atas, dengan celah yang melebar.
* Pola pembalikan bearish - harga kehilangan momentum naik.
* Perdagangan: Tunggu tembus batas bawah, masuk posisi jual.
5. Baji Turun (Mengembang) ⚠️
* Kedua batas miring ke bawah, dengan celah yang melebar.
* Pola pembalikan bullish - harga kehilangan momentum turun.
* Perdagangan: Tunggu tembus batas atas, masuk posisi beli.
6. Segitiga Menyimpang (Segitiga Melebar) 🔺
* Batas atas miring ke atas, batas bawah miring ke bawah.
* Pola ekspansi volatilitas tinggi.
* Perdagangan: Sangat berisiko, tunggu tembusan arah yang jelas.
7. Segitiga Naik (Mengembang) 📊
* Batas atas horizontal, batas bawah miring ke atas.
* Kelanjutan bullish dengan rentang yang melebar.
* Perdagangan: Beli tembus batas atas.
8. Segitiga Turun (Mengembang) 📊
* Batas bawah horizontal, batas atas miring ke bawah.
* Kelanjutan bearish dengan rentang yang melebar.
* Perdagangan: Jual tembus batas bawah.
BAJI MENYEMPIT (Formasi Menyatu) 🔻
9. Baji Naik (Menyempit) 🔺
* Kedua batas miring ke atas, dengan celah yang menyempit.
* Pola pembalikan bearish - kelelahan bullish ⚠️
* Perdagangan: Jual saat tembus batas bawah.
10. Baji Turun (Menyempit) 🔻
* Kedua batas miring ke bawah, dengan celah yang menyempit.
* Pola pembalikan bullish - kelelahan bearish ⚠️
* Perdagangan: Beli saat tembus batas atas.
SEGITIGA MENYEMPIT (Formasi Konsolidasi) △
11. Segitiga Menyatu (Segitiga Simetris) ⚖️
* Batas atas miring ke bawah, batas bawah miring ke atas dengan kecepatan serupa.
* Konsolidasi netral - pola kelanjutan.
* Perdagangan: Tunggu arah breakout, lakukan perdagangan sesuai.
12. Segitiga Turun (Menyempit) 📐
* Batas bawah horizontal (support), batas atas miring ke bawah.
* Pola kelanjutan bearish 🔴
* Perdagangan: Jual saat support tembus dengan volume.
13. Segitiga Naik (Menyempit) 📐
* Batas atas horizontal (resistance), batas bawah miring ke atas.
* Pola kelanjutan bullish 🟢
* Perdagangan: Beli saat resistance tembus dengan volume.
14. Tidak Valid/Tidak Dikenal ❌
* Pola yang tidak memenuhi kriteria geometris.
* Disaring secara otomatis.
Ringkasan
Key functionalities include identifying potential breakout zones, visualizing market structure through geometric price relationships, and supporting trading of continuation and reversal patterns with visual confirmation. Users can filter detected patterns by trend direction, pivot type, and formation category. The indicator prevents overlapping and duplicate patterns to maintain clarity.
The 14 detected formations cover a range of classical patterns such as ascending, descending, and ranging channels; expanding and contracting wedges; and various triangle types (converging, diverging, ascending, descending). Visual outputs include color-coded boundary lines, pivot numbering, zigzag swing lines, and labeled pattern names for easy interpretation. This tool supports analysis across multiple markets including Forex, stocks, commodities, indices, and cryptocurrencies.
Ulasan pelanggan
5 | 50 % | |
4 | 50 % | |
3 | 0 % | |
2 | 0 % | |
1 | 0 % |


![Logo "[Hamster-Coder] Moving Average MTF"](https://cdn.ctrader.com/image/webp/b11b98b1-194d-4b8e-b00e-d611826ad159_31226)


