
Deskripsi
Indikator Toko Pinescriptlabs: Toko cBots Pinescriptlabs : (cBot) Gold & BTC BreakoutSession Pivots(baru)
Struktur Pasar Lanjutan: Bos, Choch, SwinLevels, Order Blocks, Penemu Struktur Pasar & Likuiditas (Baru)
Proyeksi Likuiditas Harga ZigZag
Algoritma Pintar Trailing (baru)
Prediksi Berdasarkan Linreg & ATR
SmartTrend Dukungan &
Perlawanan
Garis
Dinamis
Analisis Struktur Pasar
dari
Titik
Pembalikan
Fibonacci
Regresi
Linear
Multi-timeframe
Multi-Level
Pelacak Bias Lilin
Tracker
Otomatis
Dukungan dan
Perlawanan
Garis
Garis
Semua
Dukungan dan
Perlawanan
Level
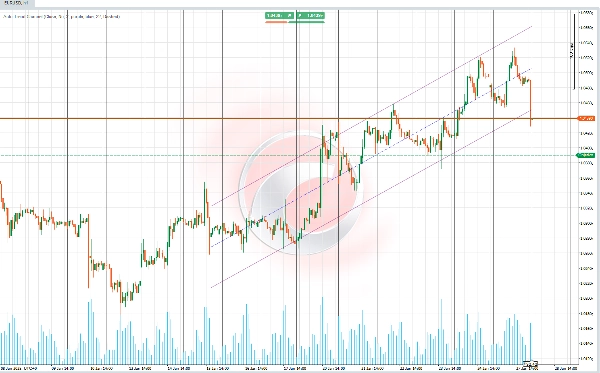
📊 Otomatis-Saluran Tren 📊
Indikator ini menggambar saluran tren berdasarkan perhitungan regresi linier dan deviasi standar data harga (logaritmik) untuk periode yang dipilih secara otomatis. 📈 Periode ditentukan menggunakan koefisien korelasi Pearson (RRR), memilih yang memiliki nilai absolut tertinggi. 🧮
✨ Fungsi Utama ✨
Fungsi utama adalah menghitung saluran tren yang secara otomatis menyesuaikan dengan panjang periode yang paling representatif, menggunakan statistik lanjutan untuk menentukan dukungan, perlawanan, dan garis tren tengah.
Saluran mencakup:
1️⃣ Sebuah garis dasar yang mewakili tren linier yang dihitung.
2️⃣ Garis atas dan bawah yang mendefinisikan pita saluran pada jarak yang proporsional dengan deviasi standar.
🚀 Fitur dan Perhitungan 🚀
🔎 Perhitungan Periode Optimal
- Indikator mengevaluasi beberapa periode data (pendek atau panjang, tergantung konfigurasi) untuk menemukan yang memiliki korelasi paling akurat dengan perilaku pasar.
- Korelasi Pearson digunakan sebagai metrik utama untuk mengidentifikasi periode dengan hubungan terkuat antara harga historis dan garis tren yang dihasilkan.
📐 Regresi Linier dan Proyeksi Harga
- Untuk setiap periode yang dievaluasi, garis regresi dihitung berdasarkan logaritma natural harga untuk menstabilkan variasi ekstrem.
- Komponen utama perhitungan meliputi:
-
- Kemiringan: Mewakili laju perubahan harga.
- Intercept: Titik awal garis proyeksi.
- Rata-rata: Menetapkan garis dasar referensi.
📊 Deviasi Standar dan Batas Saluran
- Deviasi standar harga relatif terhadap garis regresi dihitung.
- Pita atas (resistensi) dan pita bawah (dukungan) diturunkan dengan menyesuaikan garis tengah menggunakan pengali deviasi standar yang dapat dikonfigurasi pengguna.
🌈 Visualisasi Saluran Tren
- Saluran terdiri dari tiga elemen utama:
-
- Garis Tengah: Menunjukkan tren utama berdasarkan garis regresi.
- Garis Atas: Mewakili batas atas saluran (resistensi), disesuaikan dengan deviasi standar.
- Garis Bawah: Mewakili batas bawah saluran (dukungan), disesuaikan dengan deviasi standar.
- Pengguna dapat menyesuaikan warna, transparansi, dan gaya garis saluran untuk kejelasan visual yang lebih baik.
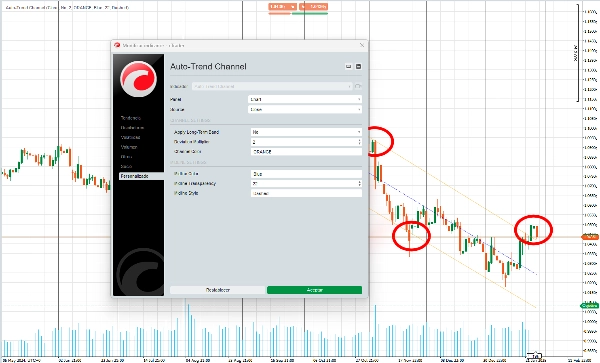
🎛️ Adaptabilitas dan Konfigurasi
- Pengguna dapat mempersonalisasi berbagai aspek indikator, seperti:
-
- Warna garis dan saluran.
- Apakah fokus pada periode panjang (tren makro) atau periode pendek (tren mikro).
- Adaptabilitas ini memastikan indikator sesuai dengan berbagai gaya trading dan preferensi visual.
🔍 Penggunaan :
1️⃣ Identifikasi Tren
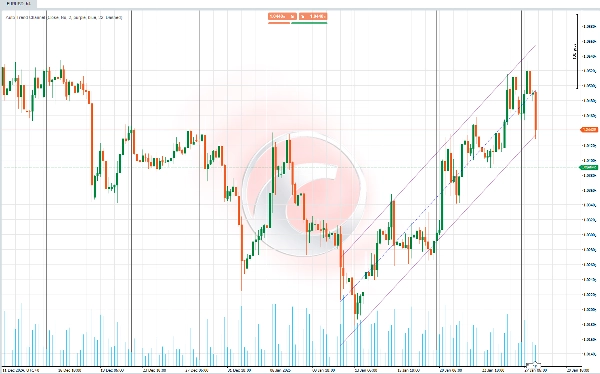
- Garis tengah saluran membantu menentukan apakah pasar sedang dalam tren naik, tren turun, atau tren mendatar.
2️⃣ Dukungan dan Perlawanan Dinamis
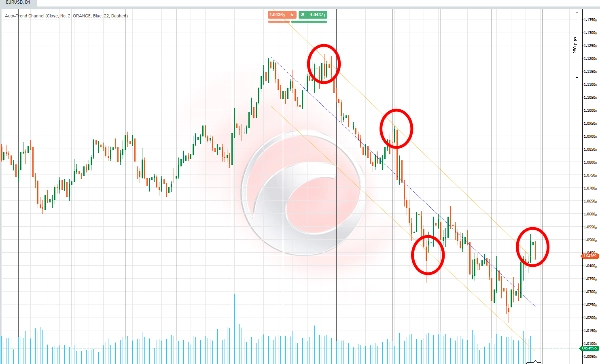
- Garis saluran atas dan bawah berfungsi sebagai zona potensial di mana harga dapat berbalik atau mengonsolidasikan.
3️⃣ Deteksi Konsolidasi dan Breakout
- Harga yang tetap berada dalam saluran menunjukkan konsolidasi, sementara breakout menunjukkan perubahan tren atau pergerakan harga yang kuat.
4️⃣ Penyesuaian untuk Berbagai Gaya Trading
- Periode panjang berguna untuk mengidentifikasi tren umum dan membuat keputusan strategis dalam kerangka waktu yang lebih luas.
- Periode pendek memungkinkan trader menangkap pergerakan lebih cepat dan merespons perubahan pasar secara langsung.
Ringkasan
Key features include:
- Optimal period selection by evaluating multiple data intervals to find the strongest correlation between historical prices and the trend line.
- Calculation of slope, intercept, and mean for precise linear regression and price projection.
- Visualization of the trend channel with customizable colors, transparency, and line styles.
- Adaptability for different trading styles by allowing focus on long-term (macro) or short-term (micro) trends.
Use cases:
- Identifying market trends (uptrend, downtrend, sideways) via the central trend line.
- Detecting dynamic support and resistance zones where price may reverse or consolidate.
- Recognizing consolidation phases within the channel and breakouts signaling trend changes or strong price movements.
- Adjusting analysis to suit strategic decisions or faster market responses depending on selected period length.
This indicator supports various markets including cryptocurrencies (BTCUSD), commodities (XAUUSD), and others, providing a statistical approach to trend and channel analysis.
Ulasan pelanggan
5 | 60 % | |
4 | 20 % | |
3 | 20 % | |
2 | 0 % | |
1 | 0 % |


![Logo "[Stellar Strategies] Inside Bar with Signals"](https://cdn.ctrader.com/image/webp/1d9e8bfa-3b2c-4440-bb37-5856902008a7_30683)


