
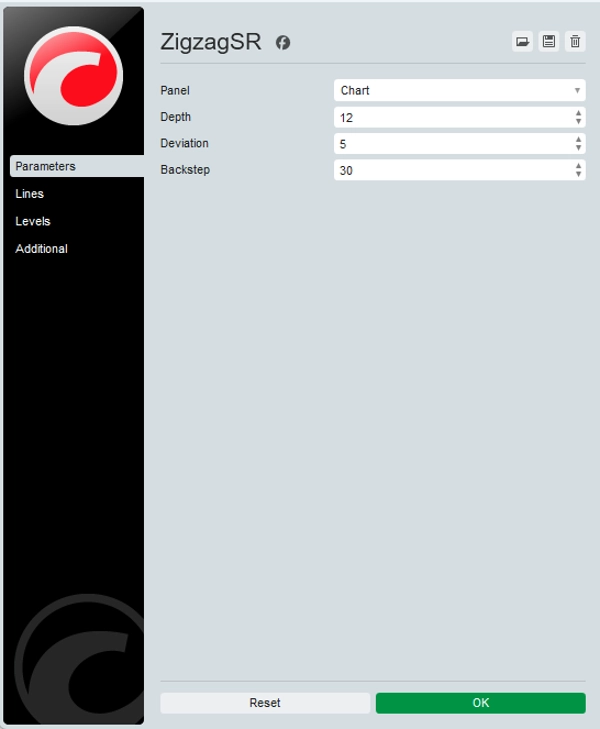
ZigzagSR
インジケーター
5 購入済
バージョン 1.0、Jun 2025
Windows、Mac
4.3
レビュー: 3
説明
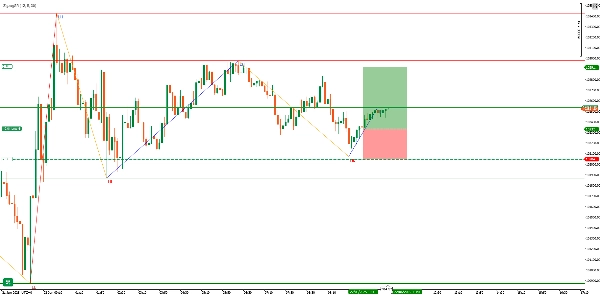
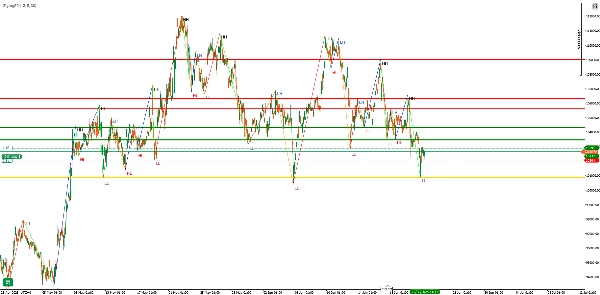
ZigzagSR – 自動サポート&レジスタンスを備えた動的ジグザグスイング
ZigzagSRは、次の機能を持つ強力なcTraderインジケーターで、市場構造をより明確にし、正確なエントリーゾーンを解放します:
- リアルタイムで非再描画のジグザグスイング(高値更新、高値切り下げ、安値切り上げ、安値更新)をプロット
- 最新のピボットスイングに基づいて動的なサポート&レジスタンスレベルを自動描画
- 各スイングポイントに「HH」「LH」「HL」「LL」のラベルを付け、一目でトレンドの明確化を実現
主な特徴
- 適応型ジグザグ検出
-
- 市場ノイズへの感度を微調整するための設定可能な Depth、Deviation、および Backstepパラメーター
- 非再描画ロジックにより、描画された過去のシグナルが安定して保持される
- 自動SRレベル
-
- 最後の有効なスイングポイントに Pivotラインを描画(金色のライン)
- ピボット前の最大3つの Resistance高値(赤線)と3つの Support安値(緑線)をハイライト
- 新しいスイングが形成されるとラインがシームレスに更新され、チャートを整頓
- 明確な視覚ラベル
-
- 弱気/高値ピーク用の「HH」(Higher High)と「LH」(Lower High)
- 強気/安値谷用の「HL」(Higher Low)と「LL」(Lower Low)
- 色分けされたジグザグセグメント:
-
- HH → ライム
- LH → オレンジ
- HL → ブルー
- LL → レッド
入力とカスタマイズ
パラメーター デフォルト 説明
Depth
12
ローカルの高値/安値を識別するための過去バー数
Deviation
5
スイングとしてカウントするための最小価格変動(ティック単位)
Backstep
3
誤ったピボットを抑制するために「巻き戻す」バー数
ヒント: 高い時間軸ではノイズをフィルターするために Depthと Deviationを増やし、M1/M5では感度を高めるためにそれらを下げてください。
なぜZigzagSRを使うのか?
- トレンド確認:インパルススイングと修正ムーブを明確に区別—スイングトレーダーやブレイクアウトトレーダーに最適。
- SRエントリーゾーン:自動でマークされたレベルにより、ラインを手動で引かずにエントリー、ストップロス、テイクプロフィットゾーンを特定可能。
- 戦略開発:ラベルとラインはEA/cBotや手動システムに直接フィード—一貫したルールベースのセットアップを構築。
動作方法
- 高値/安値マッピング
-
- 過去
Depth期間のバーをスキャンし、ローカルの極値(_highMap&_lowMap)をフラグ付け。
- 過去
- スイング構築
-
- 強気と弱気の状態を交互に切り替え、重要なピボットのみをスイングリストに追加。
- ラベル割り当て
-
- 各ピボットを前のものと比較し、HH/LHまたはHL/LLとしてタグ付け。
- SR描画
-
- 最新のピボットを「ピボットライン」として特定し、その前の3つの有効な高値と安値をレジスタンス/サポートとしてプロット。
- ジグザグ描画
-
- すべてのスイングポイントを色分けされたトレンドラインで接続し、テキストラベルを少しずらして重ねて明瞭に表示。
使用例とヒント
- スイングトレード:複数バーのインパルスに乗り、ピボットラインへのプルバックでエントリーし、次のSRレベルをターゲットに。
- ブレイクアウト確認:ZigzagSRが描いたレジスタンスラインを価格が突破するのを待ち、ボリュームやRSIで確認。
- 他のインジケーターとの重ね合わせ:移動平均線、RSIダイバージェンス、ボリュームプロファイルと組み合わせてシグナルを強化。
数秒で始める:
- cTraderストアからZigzagSRをインストール。
- 任意のチャートにドロップ—外部ライブラリは不要。
- 3つの入力パラメーターを好みの時間軸と戦略スタイルに調整。
リアルタイムのスイング構造と動的なサポート&レジスタンスでチャート分析を向上させましょう—今すぐ ZigzagSRをお試しください!
概要
AIによる概要
ZigzagSR is a cTrader indicator that dynamically identifies market swings and automatically plots support and resistance (SR) levels. It detects non-repainting zigzag swings in real time, labeling each pivot as Higher High (HH), Lower High (LH), Higher Low (HL), or Lower Low (LL) to clarify trend direction. The indicator draws a pivot line at the latest valid swing point and highlights up to three preceding resistance highs and support lows, updating these levels seamlessly as new swings form.
Key customizable parameters include Depth (look-back bars for local highs/lows), Deviation (minimum price move in ticks to qualify as a swing), and Backstep (bars to rewind to suppress false pivots). This adaptive detection allows users to fine-tune sensitivity to market noise across different timeframes.
ZigzagSR supports trend confirmation by distinguishing impulsive versus corrective swings, aids in identifying precise entry, stop-loss, and take-profit zones, and facilitates strategy development by providing clear labels and lines usable in automated or manual trading systems. Typical use cases include swing trading, breakout confirmation, and combining with other indicators such as RSI or moving averages for enhanced signal validation.
Installation requires adding ZigzagSR to any cTrader chart with no external dependencies, followed by parameter adjustment to fit individual trading styles and timeframes.
インジケーターのプロフィール
カスタマーレビュー
4.3
レビュー: 3
5 | 33 % | |
4 | 67 % | |
3 | 0 % | |
2 | 0 % | |
1 | 0 % |
カスタマーレビュー
November 9, 2025
ZigzagSR combines classic wave mapping with auto S/R zones. Clean, responsive, and great for spotting turning points. A must-have for structure-focused traders. Could use alerts for new high/low formations, but performance and clarity are top-notch.
July 6, 2025
the review gets easier when it adds a check without pretending to know everything, and It needs a boring test before bigger size.
ディスカッション
よくあるご質問
Breakout
Commodities
RSI
XAUUSD
cTrader Storeで入手可能な取引ボット、インジケーター、プラグインなどの商品は、第三者の開発者が提供するものであり、情報と技術の取得のみを目的としてご利用いただけます。cTrader Storeはブローカーではなく、投資助言や個人的な推奨を行うことも、将来のパフォーマンスを保証することもありません。


![「Gaussian Channel [Iridio Capital]」ロゴ](https://cdn.ctrader.com/image/webp/7c039209-5573-4a54-a072-f9528b503103_41960)


価格
登録日 22/11/2024
136
販売
2.6K
無料インストール