
Multi-Timeframe Market Levels
インジケーター
10 購入済
バージョン 1.0、Dec 2024
Windows、Mac
5.0
レビュー: 1
説明
強化サポートレジスタンスインジケーター
cAlgo用の強化サポートレジスタンスインジケーターでテクニカル分析の力を解き放ちましょう。この高度なツールは、トレーダーが取引チャート上の重要なサポートおよびレジスタンスレベルを特定し視覚化するのを支援し、意思決定と取引戦略を強化するよう設計されています。
主な特徴:
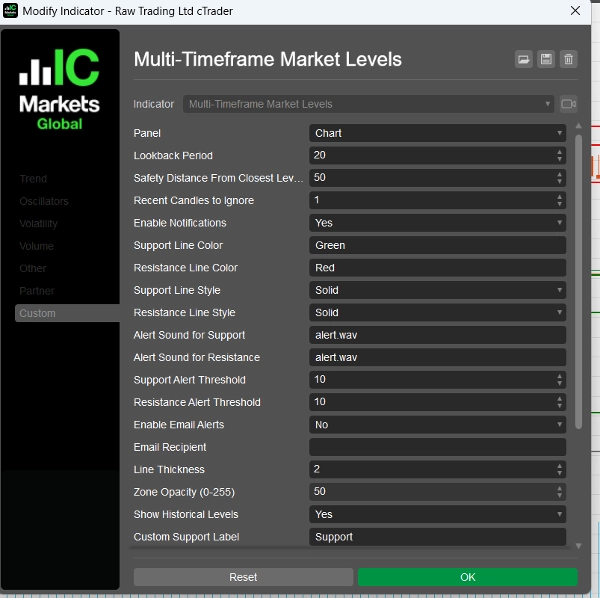
- カスタマイズ可能なパラメーター:ルックバック期間、安全距離、アラート音など、調整可能な設定でインジケーターをあなたの取引スタイルに合わせて調整できます。
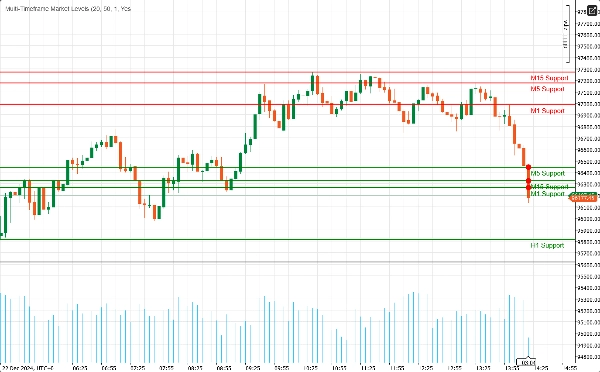
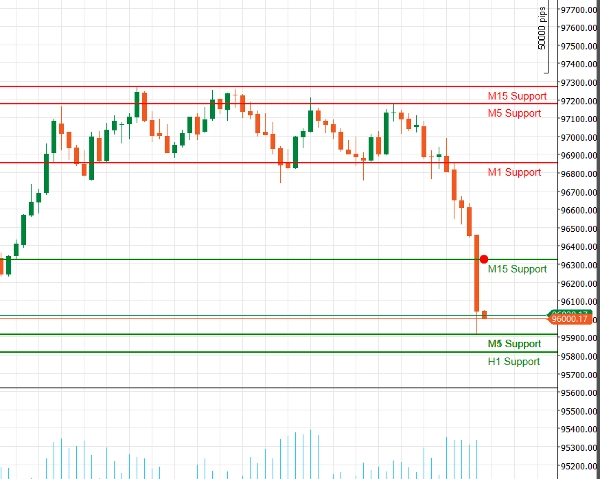
- マルチタイムフレーム対応:複数のタイムフレーム(M1、M5、M15、H1、H4、D1)を同時に分析し、市場の動態を包括的に把握し、異なる取引期間にわたる重要なレベルを特定します。
- リアルタイムアラート:即時通知で情報を常に把握!価格が重要なサポートまたはレジスタンスレベルに近づくと、音声アラートやメール通知を送信し、取引機会を逃しません。
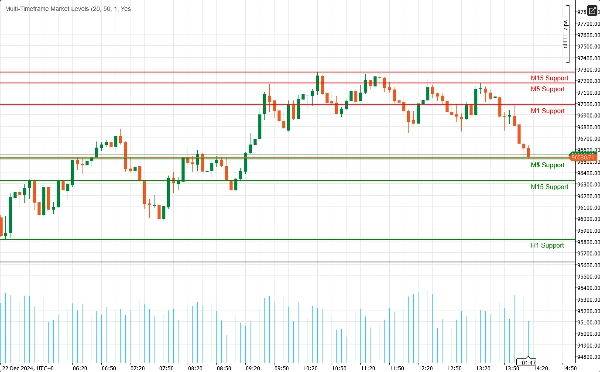
- 視覚的明瞭さ:カスタマイズ可能な色と線のスタイルでサポートおよびレジスタンスレベルを明確に視覚化。ハイライトされたゾーンは追加のコンテキストを提供し、反転ポイントの特定を容易にします。
- フィボナッチ統合:組み込みのフィボナッチレベル描画機能で分析を強化し、サポートおよびレジスタンスと組み合わせて潜在的なリトレースメントおよびエクステンションレベルを特定できます。
- ユーザーフレンドリーなインターフェース初心者から経験豊富なトレーダーまで使いやすく設計されており、既存のcAlgo環境にシームレスに統合できます。
強化サポートレジスタンスインジケーターの使い方
- インストール:
-
- インジケーターをダウンロードし、cAlgoプラットフォームにインポートします。
- 希望のチャートにインジケーターを適用します。
- パラメーターの設定:
-
- 取引スタイルに合わせて設定を調整します。ルックバック期間、安全距離を設定し、サポートおよびレジスタンスレベルの色や線のスタイルを選択します。
- 価格がこれらのレベルに近づいたときに通知を受け取りたい場合は、通知を有効にします。
- タイムフレームの選択:
-
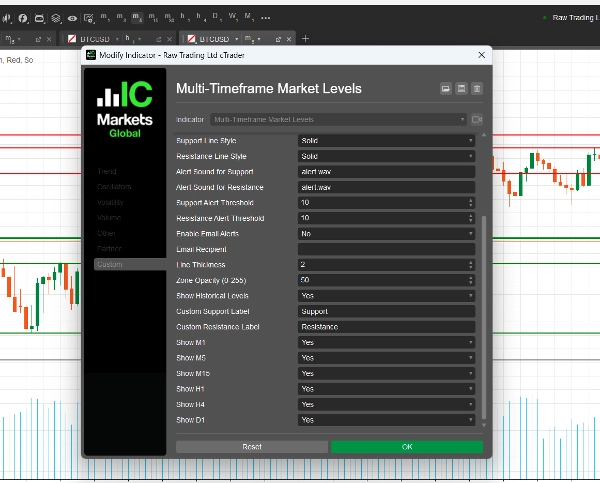
- 表示したいタイムフレームを選択します。取引戦略に応じて、M1、M5、M15、H1、H4、D1のレベルを表示または非表示にできます。
- チャートの分析:
-
- チャートに描画されたサポートおよびレジスタンスレベルを観察します。これらのレベルは、価格が反転または統合する可能性のある場所を示します。
強化サポートレジスタンスインジケーターを使った取引方法
- エントリーポイントの特定:
-
- ロングトレード:価格がサポートレベルに近づき、反発の兆候(例:強気のローソク足パターン)が見られる場合に買いの機会を探します。
- ショートトレード:価格がレジスタンスレベルに近づき、弱気のシグナル(例:弱気のローソク足パターン)がある場合に売りを検討します。
- アラートの活用:
-
- 価格が重要なサポートまたはレジスタンスレベルに近づいたときにリアルタイムアラートを利用して通知を受け取り、迅速に行動して取引機会を活かします。
- 他のインジケーターとの組み合わせ:
-
- 強化サポートレジスタンスインジケーターを他のテクニカルインジケーター(例:移動平均線、RSI、MACD)と組み合わせてシグナルを確認し、取引の精度を向上させます。
- ストップロスとテイクプロフィットレベルの設定:
-
- ロングトレードの場合はサポートレベルのすぐ下に、ショートトレードの場合はレジスタンスレベルのすぐ上にストップロス注文を置いてリスクを管理します。
- 次の重要なサポートまたはレジスタンスレベルにテイクプロフィット目標を設定し、潜在的な利益を最大化します。
なぜ強化サポートレジスタンスを選ぶのか?
金融市場の複雑さを乗り越えるのは難しいことがあります。 強化サポートレジスタンスインジケーターは、重要な価格レベルを特定し、情報に基づいた取引判断を下すために必要なツールを提供します。デイトレーダーであれ長期投資家であれ、このインジケーターはあなたの取引ツールキットに欠かせない追加要素です。
概要
AIによる概要
The Multi-Timeframe Market Levels indicator for cAlgo is an enhanced support and resistance tool designed to assist traders in identifying critical price levels across multiple timeframes. It supports simultaneous analysis of M1, M5, M15, H1, H4, and D1 charts, providing a comprehensive view of market dynamics. Key features include customizable parameters such as lookback periods, safety distances, alert sounds, and visual settings like colors and line styles for clear chart representation. The indicator integrates Fibonacci levels to identify potential retracement and extension zones alongside support and resistance. Real-time alerts via audio and email notify users when price approaches key levels, facilitating timely trading decisions. The user-friendly interface is suitable for both novice and experienced traders and integrates seamlessly into the cAlgo platform. Traders can use the indicator to identify entry points for long and short trades, set stop-loss and take-profit levels based on support and resistance, and combine it with other technical indicators like RSI and MACD for enhanced strategy accuracy. Installation involves importing the indicator into cAlgo and attaching it to desired charts, followed by parameter configuration and timeframe selection. This tool aids in visualizing potential reversal or consolidation zones to support informed trading decisions.
インジケーターのプロフィール
カスタマーレビュー
5.0
レビュー: 1
5 | 100 % | |
4 | 0 % | |
3 | 0 % | |
2 | 0 % | |
1 | 0 % |
カスタマーレビュー
August 18, 2025
Displays support/resistance levels from multiple timeframes in one chart. Clear visual hierarchy and flexible settings. Cons: No alerts or tooltips. Can't save presets or filter levels dynamically.
ディスカッション
よくあるご質問
RSI
MACD
cTrader Storeで入手可能な取引ボット、インジケーター、プラグインなどの商品は、第三者の開発者が提供するものであり、情報と技術の取得のみを目的としてご利用いただけます。cTrader Storeはブローカーではなく、投資助言や個人的な推奨を行うことも、将来のパフォーマンスを保証することもありません。


これも好きかも


価格
登録日 22/11/2024
133
販売
2.58K
無料インストール