
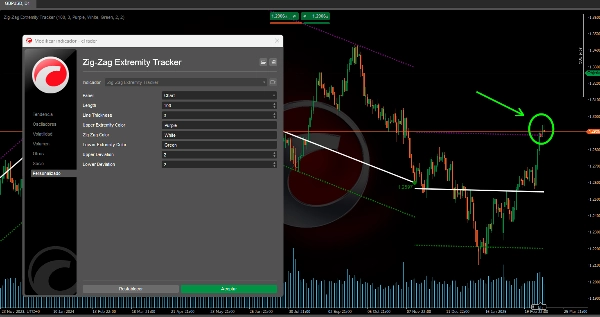
Zig-Zag Extremity Tracker
インジケーター
2 購入済
バージョン 1.0、Mar 2025
Windows、Mac
4.5
レビュー: 2
説明
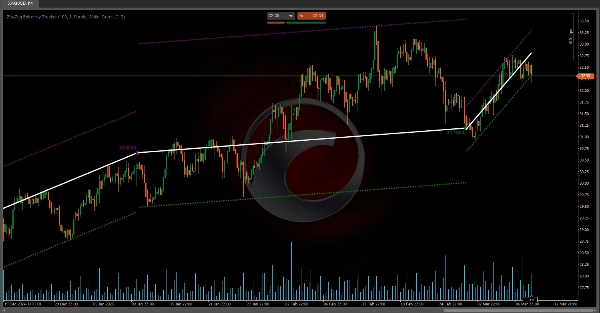
💡 線形回帰チャネルとジグザグポイント 💡
• 線形回帰チャネルは、価格が予想される境界線(バンド)を超えるたびに再計算およびリセットされ、市場の実際のトレンドに合わせて測定が最新の状態に保たれます。
• マークされたポイント(円)は、ジグザグを描画し、チャネルが計算される基点となる極値(高値と安値)を表しています。
• この動的なアプローチにより、潜在的なトレンドの変化や、価格が平均に戻る可能性のある過伸張や過売の領域をより良く視覚化できます。
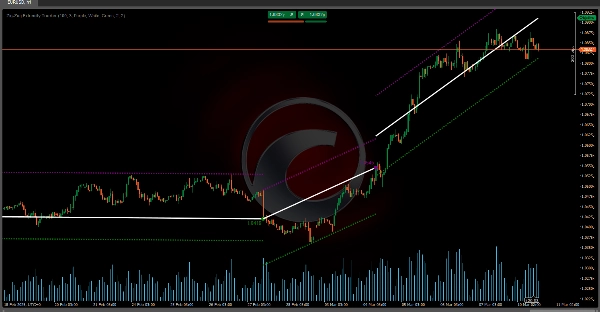
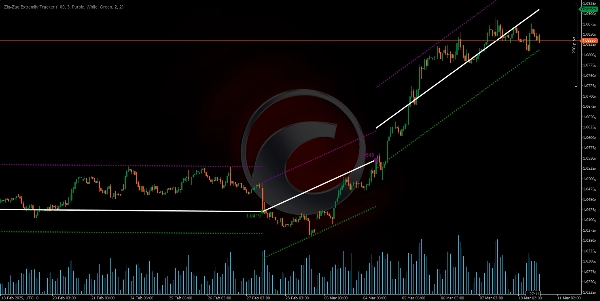
❓ チャネルはジグザグおよび極値とどのように関連していますか? ❓
• 新しい極値(高値または安値)が検出されるたびに、インジケーターはそのポイントと前のポイントを結ぶジグザグラインと円を描画するだけでなく、その最後の極値から描かれる可能性のある線形回帰チャネルも再調整します。
• その後のバーで価格がバンド内に留まる場合、チャネルはアクティブなままで現在のバーまで延長されます。
• 価格がバンドを突破した場合、インジケーターはチャネルが無効になったと「判断」し、ブレイクが発生したバーから新しいチャネルを開始します。
Ctraderストアのインジケーター:
概要
インジケーターのプロフィール
カスタマーレビュー
4.5
レビュー: 2
5 | 50 % | |
4 | 50 % | |
3 | 0 % | |
2 | 0 % | |
1 | 0 % |
カスタマーレビュー
March 18, 2025
March 11, 2025
It makes sense mainly because the decision feels less rushed, and the first test should keep DD under 3 percent.
ディスカッション
よくあるご質問
Breakout
Supertrend
RSI
cTrader Storeで入手可能な取引ボット、インジケーター、プラグインなどの商品は、第三者の開発者が提供するものであり、情報と技術の取得のみを目的としてご利用いただけます。cTrader Storeはブローカーではなく、投資助言や個人的な推奨を行うことも、将来のパフォーマンスを保証することもありません。


価格
登録日 03/10/2024
163
販売
38.15K
無料インストール