
New Way Sar - Pro
インジケーター
3 購入済
バージョン 1.0、Sep 2025
Windows、Mac
4.5
レビュー: 2
説明
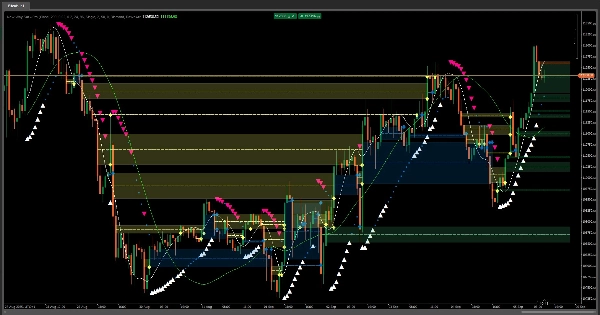
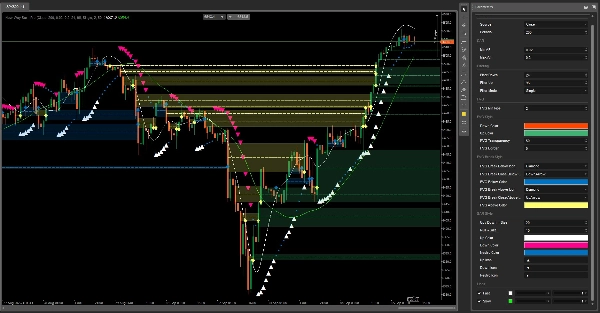
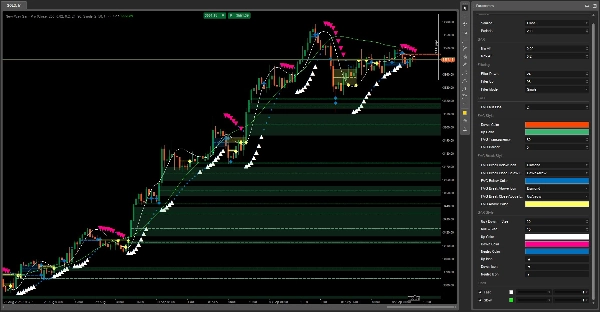
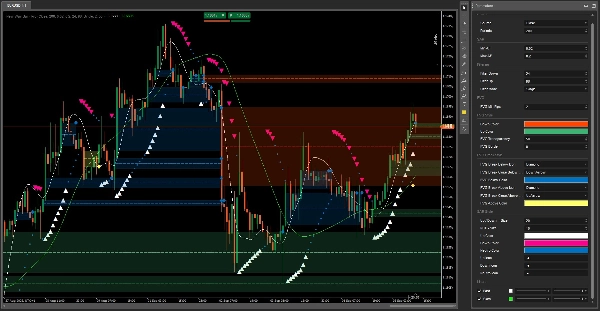
パラボリックSAR、または「ストップアンドリバース」は、トレーダーが潜在的なトレンドの反転を特定し、トレーリングストップロス注文を設定するのに役立つ動的なテクニカル分析ツールです。従来の指標とは異なり、パラボリックSARは価格の動きに沿って一連の点を作成し、トレンドが勢いを増すにつれて調整されます。
私たちの最新バージョンは、このクラシックな指標に新鮮で直感的なアプローチを提供します。強力で信頼性の高いシグナルとクリーンでモダンなデザインを組み合わせることで、トレーダーがトレンドの方向性や潜在的なエントリー・エグジットポイントを簡単に視覚化できるようにします。フェアバリューギャップなどの重要な市場レベルを統合することで、このバージョンはより正確で自信を持った取引判断を下すための包括的なシステムを提供し、市場を自信を持ってナビゲートするために必要な明確さを与えます。
概要
インジケーターのプロフィール
カスタマーレビュー
4.5
レビュー: 2
5 | 50 % | |
4 | 50 % | |
3 | 0 % | |
2 | 0 % | |
1 | 0 % |
カスタマーレビュー
October 8, 2025
Smooth and smart SAR! 🔄 Adapts to volatility, cuts false flips, and keeps your trades on trend. Perfect for swing and trend lovers who want cleaner signals without the noise."
September 18, 2025
A calm trader gets value from weak ideas are easier to skip. It can look better than it is during a lucky run.
ディスカッション
よくあるご質問
Prop
Forex
Signal
Scalping
Indices
Supertrend
Commodities
Crypto
Stocks
cTrader Storeで入手可能な取引ボット、インジケーター、プラグインなどの商品は、第三者の開発者が提供するものであり、情報と技術の取得のみを目的としてご利用いただけます。cTrader Storeはブローカーではなく、投資助言や個人的な推奨を行うことも、将来のパフォーマンスを保証することもありません。


価格
147
販売
11.19K
無料インストール