
説明
🏆 10,000人以上のトレーダーが私たちの25以上のアルゴリズムスイートを信頼しています! 🏆
から マーケット構造&流動性 まで スマートエグジットシステム&予測ツール - 一貫した取引に必要なすべてのツールを構築しました。
👉 すべての25以上の実証済みシステムにアクセス:
_______________________________________________
📌 マーケット構造インジケーター
· ✅ AdvancedMarket Structure: Bos, Choch, SwinLevels, Order Blocks, マーケット構造&流動性ファインダー
· 🧱 オーダーブロック
· ⚖️ マーケットアンバランス
· ⛓️ BOS&CHOCH
· 🧠 ICTパワーオブ3
· 🌀 マーケットポラリティゾーン
_______________________________________________
🔚 スマートエグジットシステム
· 📍 トレーリングスマートアルゴリズム
_______________________________________________
📐 ジグザグインジケーター
· 🔍 ジグザグ価格流動性予測
· 🧭 S&R構造ジグザグ
· ➖ ジグザグ
· 🎯 ジグザグ極端トラッカー
_______________________________________________
🧱 サポート&レジスタンスインジケーター
_______________________________________________
📊 トレンド&チャネルインジケーター
· 🔄 オートトレンドチャネル
· 📊 スーパートレンド
· 🧠 アダプティブトレンドチャネル
· 💥 チャネルブレイクアウトシステム
· ⭐ プレミアムSSLチャネル
· 🔁 リアクティブ移動平均
_______________________________________________
💧 ボリューム&流動性ツール
· 🔥 ボリュームPOCヒートマップ
· 📉 レバレッジ清算マップ
· 🔍 モメンタムフェアバリューギャップ
· 🕒 フェアバリューギャップセッション
_______________________________________________
⚡ モメンタム&RSIインジケーター
· 📈 RSIトレンドトリガー
· 🚀 ダイナミックレンジモメンタム
_______________________________________________
🔮 予測&投影ツール
· 📐 Linreg&ATRに基づく予測
· 📈 ボリューム駆動マーケットフロープロジェクター_________________________
_________________________________________________________________________________________________
_________________________________________________________________________________________________
ジグザグストラクチャープロ – 🚀
市場の重要な転換点(主要な高値と安値)を自動的に識別し、 リアルタイムで更新される動的なサポートおよびレジスタンスゾーンを描画します。 🎯 従来の静的レベルとは異なり、このインジケーターは 価格構造の変化に常に適応します。
何のために使うの? ❓
このインジケーターは、以下の目的で設計されたプロフェッショナルなテクニカル分析ツールです:
- 機関レベルの特定: 🏛️ 価格が重要な高値と安値の構造を形成したポイントを自動検出します。
- マーケット構造分析: 📊 各動きを強気/弱気の構造メソッド(高値更新、安値更新など)に基づいて分類します。
- トレンド予測: 🔮 トレンドラインを未来に延長し、潜在的な価格反応ゾーンを予測します。
- 反転および継続の取引: 💰 マークされたレベルはエントリー、ストップロス、利益目標の参考になります。
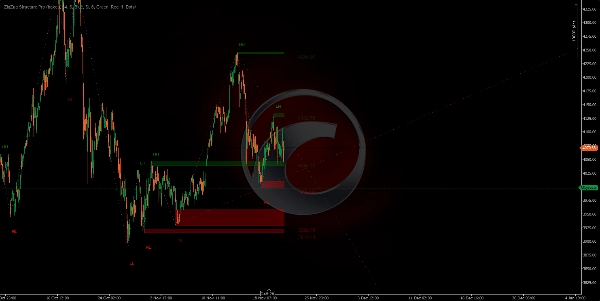
インジケーターがチャートに描画するもの: ✍️
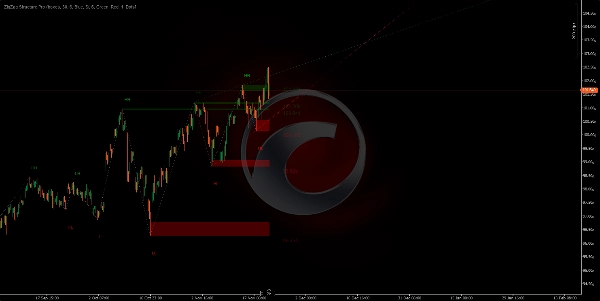
1. サポート/レジスタンスゾーン(長方形)
- 緑のゾーン: 🟢 価格が反発する可能性のある重要な安値のサポートエリアをマークします。
- 赤のゾーン: 🔴 価格が押し戻される可能性のある重要な高値のレジスタンスエリアをマークします。
- これらのゾーンは 前方に投影され、現在のアクティブなレベルを示します。
- 各ゾーンの 厚さはピボットが形成されたローソク足の実体を表しています。
https://chartshots.spotware.com/c/691f5a4d75ac4
https://chartshots.spotware.com/c/691f6b4f2e98b
https://chartshots.spotware.com/c/691f6c6fda808
https://chartshots.spotware.com/c/691f6d0aa6155
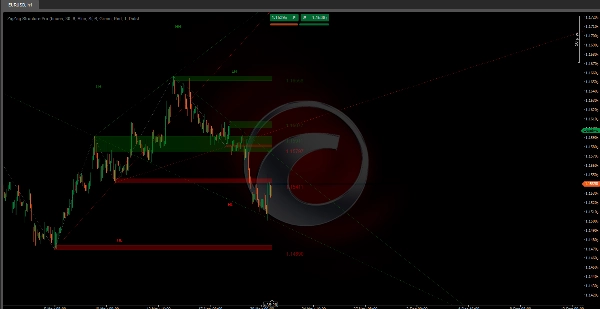
2. 接続線 ⚡
- 各ピボットを次のピボットと接続し、視覚的な「ジグザグ」パターンを作成します。
- 市場のノイズを排除し、真に重要な動きのみを表示します。
- トレンドの 方向と構造を一目でわかりやすくします。
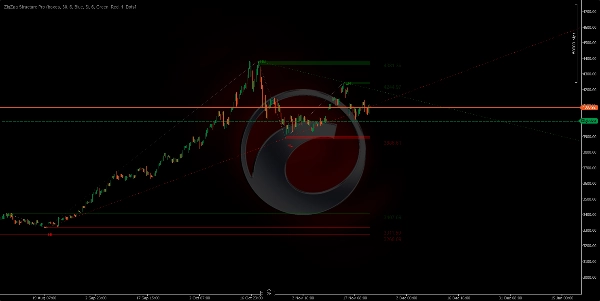
3. 投影トレンドライン(拡張された緑/赤)
- 前のピボットから現在のピボットに引かれ、未来に向かって延長されます。
- 緑: 🟢 強気のトレンドライン(安値から)。
- 赤: 🔴 弱気のトレンドライン(高値から)。
- 最新かつアクティブな 2本のトレンドラインを表示します。
- トレンドのブレイクアウトや反発を検出するのに役立ちます。
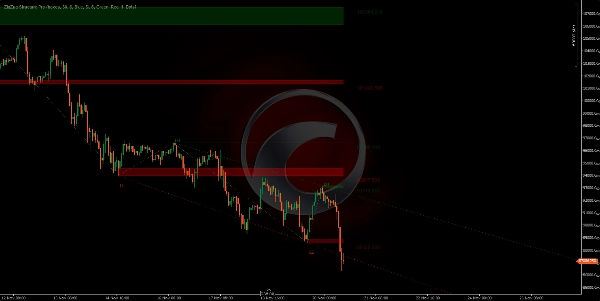
4. マーケット構造ラベル 🏷️
各ピボットにはその分類を示すラベルが表示されます:
- HH(ハイヤーハイ): ↗️ 高値更新 - 強気の継続。
- LH(ローワーハイ): ⬆️ 低い高値 - 弱気の反転の可能性。
- HL(ハイヤーロー): ⬇️ 高い安値 - 強気の反転の可能性。
- LL(ロワーロー): ↘️ 安値更新 - 弱気の継続。
アルゴリズムのロジック 🧠
このインジケーターは適応型ジグザグアルゴリズムを使用しており、以下を行います:
- 設定可能な期間内(デフォルト34バー)で高値と安値をスキャンします。
- 重要でない動きをフィルタリングし 最小偏差閾値(デフォルト6ピップス)を通じて。
- 各ピボットを検証し 市場構造の実際の変化を表していることを確認します。
- 連続するピボット間の構造を比較して動きの種類を分類します。
- 新しいピボットが現れるとゾーンを動的に更新し 最も古いものを削除します。
主な設定 ⚙️
- ピボットルックバックバー: ピボット検出器の感度を制御します(低いほどピボットが多く、高いほど主要なピボットのみ)。
- 価格偏差フィルター: ノイズフィルター - この値より小さい動きは無視されます。
- 最大表示ゾーン数: 表示される履歴レベルの数(1から20まで)。
- ゾーン表示タイプ: 長方形(完全なゾーン)または単純な線のいずれかを選択します。
- 拡張トレンドラインの表示: トレンド予測のオン/オフ。
クイックパラメーターガイド 📖
ピボットルックバックバー (デフォルト: 30)
- ↑ 増加 (40-100): ピボットが少なく、重要なもののみ。 スイングトレード向け。
- ↓ 減少 (15-25): ピボットが多く、シグナルも多い。 スキャルピング/デイトレード向け。
価格偏差フィルター (デフォルト: 6)
- ↑ 増加 (8-15): ノイズをフィルタリングし、大きな動きのみを対象。シグナルは少ないが質が高い。
- ↓ 減少 (2-5): より敏感で小さな動きも捉える。シグナルは多い。
最大表示ゾーン数 (デフォルト: 6)
- ↑ 増加 (10-20): より多くの履歴レベルを表示。詳細な分析向け。
- ↓ 減少 (2-4): 最近のレベルのみ。チャートがすっきりします。
履歴ピボット制限 (デフォルト: 200)
- ↑ 増加 (300-500): 計算のためのより多くの履歴。長期分析向け。
- ↓ 減少 (50-150): 最近の構造のみ。パフォーマンス向上。
アクティブ投影数 (デフォルト: 5)
- ↑ 増加 (5-10): より多くの投影トレンドライン。
- ↓ 減少 (1-2): 支配的なトレンドのみ。より明確。
拡張トレンドラインの表示 (はい/いいえ)
- 有効: トレンドを未来に投影します。
- 無効: 履歴のジグザグのみ。
🎯 クイックセットアップ
- スキャルピング: ルックバック15-20 | 偏差3-5 | ゾーン3-4
- デイトレード: ルックバック25-35 | 偏差6-8 | ゾーン5-6
- スイングトレード: ルックバック40-60 | 偏差10-15 | ゾーン8-12
概要
Key features include:
- Support and resistance zones displayed as rectangles, with green zones marking support (significant lows) and red zones marking resistance (significant highs). These zones are projected forward to show current active levels.
- Connection lines linking pivots to form a clear zigzag pattern, illustrating trend direction and structure.
- Projected trend lines extended into the future, color-coded green for bullish trends and red for bearish trends, highlighting recent active trends and potential breakout or respect points.
- Configurable settings such as pivot lookback period, price deviation filter to reduce noise, maximum visible zones, and option to enable or disable extended trendline projections.
This indicator supports analysis across various markets including Forex, stocks, commodities, indices, and cryptocurrencies. It is suitable for different trading styles, from scalping and day trading to swing trading, by adjusting sensitivity parameters accordingly.
カスタマーレビュー
5 | 0 % | |
4 | 100 % | |
3 | 0 % | |
2 | 0 % | |
1 | 0 % |


