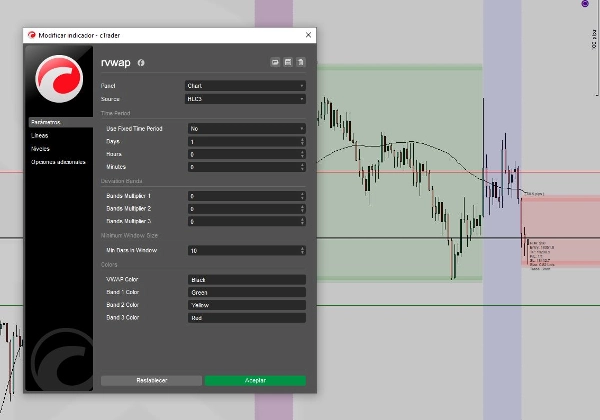
rvwap v1
「rvwap v1」ロゴ
03/09/2025
1
Desktop
登録日 13/01/2025
販売
1
「rvwap v1」アップロード画像

This Rolling VWAP (Volume Weighted Average Price) indicator for cTrader allows traders to visualize VWAP over a dynamic or fixed time period. You can customize the time window using days, hours, and minutes, or let the indicator automatically adjust based on the current chart timeframe. The source price can be selected from options like Close, Open, High, Low, HL2, HLC3, and OHLC4. It includes up to three standard deviation bands above and below the VWAP for identifying potential support and resistance zones. You can also set a minimum number of bars to ensure a reliable calculation even when the time window is short. Ideal for intraday and swing traders seeking dynamic VWAP-based signals and zones of confluence. Includes full color customization for each line. Built for precision, performance, and maximum flexibility.

0.0
レビュー: 0
カスタマーレビュー
この商品にはまだレビューがありません。お使いになったことがある方は、ぜひレビューをお願いします。
この作成者の他の商品
Pips V4Final
Displays pips from daily open with high/low. Clean, customizable, perfect for quick daily price context.
RISK V1
Automated position sizing based on risk, entry, and stop loss with ATR support and visual trade setup on charts.
これも好きかも
LT_SmartSwings
Detects swing highs/lows, structure, breakouts, trend lines, and fibs — great for price action trading.
Compare Symbol
Plots chosen symbol's close price, candlestick (wick, body) on cTrader chart, supports multiple timeframes.
VegaXLR - cTrader Multi-Timeframe Pivot Pro
Customizable multi-timeframe pivot point indicator for cTrader with alerts, Fibonacci, CPR, and more!
ADX and ADI
This custom indicator is a complete implementation of the Average Directional Index and Directional Indicators.
Volume Profile Triple Line - POC Median Mode
The Advanced Volume Profile Indicator calculates POC, Median, and Mode, revealing key price levels for smarter trading.
インジケーター
Indices
RSI
Signal
[Stellar Strategies] MARSI Signal Plotter
🚀📈 Plot buy/sell signals on Range Bars using Moving Averages and RSI. Clear, actionable trading insights.🚀📈
インジケーター
NAS100
NZDUSD
Breakout
+12
Initial Balance Breakout Signals
📈 Initial Balance Breakout Signals: visually accurate IB levels, breakout alerts & forecast zones for smart trading.
Multi_TF Candlestick Chart Overlay
Perfect for traders who demand a clear overview of multiple timeframes at a glance.
[Stellar Strategies] Wave Trend Pro
Momentum oscillator identifying reversals using dual WaveTrend lines, histogram, and OB/OS levels with optional signals.
BWMFI_Visual
BW_MFI Vizual colors bars
インジケーター
NZDUSD
XAUUSD
Stocks
+7
Signals Volatility Cloud Breakout
🎯Generate precise BUY/SELL signals. 📈🎯 Tracks trends with colored candles & clouds.
Price Speed or Acceleration v1
This Indicator will display either the speed or the acceleration of the current symbol.
インジケーター
NAS100
NZDUSD
XAUUSD
+13
MACD Crossover PRO
Customize the MACD! Choose colors, get real-time tick updates, and see crossover points for enhanced trading precision.
KDJ
The KDJ oscillator display consists of 3 lines (K, D and J - hence the name of the display) and 2 levels.
インジケーター
RSI
Breakout
XAUUSD
+5
Shielded Trend
Buy/Sell signals filtering noise, color-coded trends & strength shield 🛡️. Trade only with POWER ⚡
インジケーター
Grid
NAS100
NZDUSD
+15
RangeBoxLevel
This technical analysis indicator provides information on market sentiment, trend and price levels....
Buy and sell indicator
Buy and Sell Signals
Rsi Scalp Indi
RSI Scalper delivers split‑second entries on volatile assets.