
คำอธิบาย
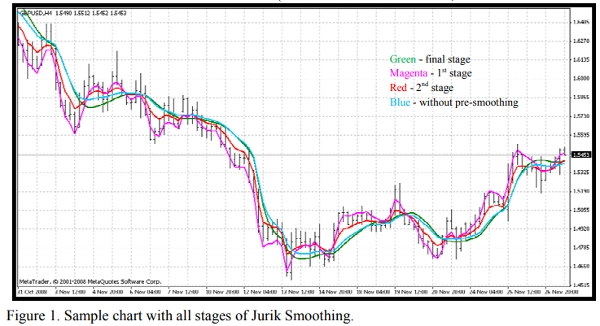
การปรับเรียบแบบ Jurik ประกอบด้วย 3 ขั้นตอน:
ขั้นตอนที่ 1 - การปรับเรียบเบื้องต้นโดย adaptive EMA: MA1 = (1-alpha)*Price + alpha*MA1[1];
ขั้นตอนที่ 2 - การปรับเรียบเบื้องต้นอีกครั้งโดย Kalman filter: Det0 = (Price - MA1)*(1-beta) + beta*Det0[1]; MA2 = MA1 + PR*Det0;
ขั้นตอนที่ 3 - การปรับเรียบขั้นสุดท้ายโดยตัวกรองปรับตัว Jurik ที่ไม่เหมือนใคร: Det1 = (MA2 - JMA[1]) * (1-alpha)^2 + alpha^2 * Det1[1]; JMA = JMA[1] + Det1;
โดยที่: - Price - ชุดราคาซีรีส์ - alpha - ตัวแปรไดนามิก (จะอธิบายด้านล่าง) - beta - อัตราส่วนตามรอบ = 0.45*(Length-1)/(0.45*(Length-1)+2) - PR - อัตราส่วนเฟส: PR = Phase/100 + 1.5 (ถ้า Phase < -100 จะเป็น PR=0.5, ถ้า Phase > 100 จะเป็น PR=2.5).
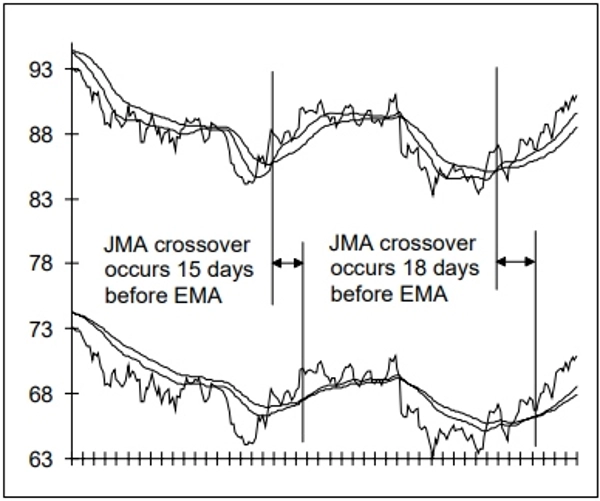
รูปที่ 1. แผนภูมิตัวอย่างพร้อมทุกขั้นตอนของการปรับเรียบแบบ Jurik คุณสามารถดูผลลัพธ์ (รูปที่ 1) ของแต่ละขั้นตอนโดยใช้ตัวบ่งชี้แนบ JurikFilter_v2 โดยเปลี่ยน FilterMode: 0 - ขั้นตอนสุดท้าย (JMA) 1 - ขั้นตอนที่ 1 2 - ขั้นตอนที่ 2 3 - ปรับเรียบขั้นสุดท้ายเท่านั้น (ไม่มีการปรับเรียบเบื้องต้น).
ตัวแปรไดนามิกคือปัจจัยตามรอบ (beta) ที่ยกกำลัง (pow):
alpha = beta ^ Pow,
โดยที่: - pow = rVolty ^ pow1 - rVolty - ความผันผวนของราคาสัมพัทธ์ - pow1 - กำลังของความผันผวนสัมพัทธ์ตามสูตรต่อไปนี้: pow1 = len1 - 2 (ถ้า pow1 < 0.5 จะเป็น pow1 = 0.5),
โดยที่ len1 - ปัจจัยตามรอบเพิ่มเติม: len1 = Log(SquareRoot(len))/Log(2.0) + 2 (ถ้า len1 < 0 จะเป็น len1 = 0).
ดังนั้นคุณจะเห็นว่าตัวแปรไดนามิกนี้ขึ้นอยู่กับความผันผวนของราคาสัมพัทธ์ซึ่งให้ความสามารถในการปรับตัวที่จำเป็นสำหรับตัวกรองราคาประเภทนี้
สูตรสำหรับความผันผวนของราคาสัมพัทธ์คือ rVolty = Volty/AvgVolty (ถ้า rVolty > len1^(1/pow1) จะเป็น rVolty = len1^(1/pow1), ถ้า rVolty < 1 จะเป็น rVolty = 1),
โดยที่:
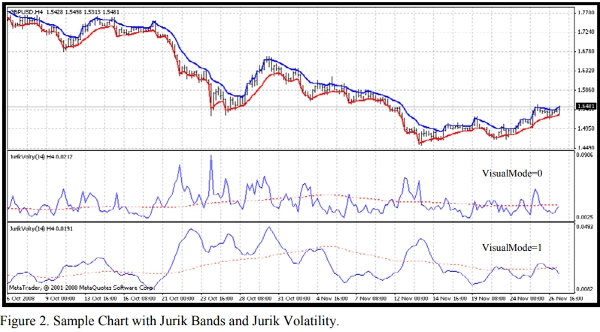
- Volty - ความผันผวนของราคาที่คำนวณจากที่เรียกว่า Jurik Bands (VisualMode = 1).
- AvgVolty - ความผันผวนเฉลี่ยซึ่ง Jurik ใช้อัลกอริทึมการคำนวณที่ซับซ้อน: AvgVolty = Average(vSum,AvgLen),
โดยที่:
- vSum - ผลรวมเพิ่มขึ้นของ (Volty - Volty[10])/10;
- AvgLen - ช่วงเวลาของค่าเฉลี่ย (Jurik ใช้ 65).
ในเวอร์ชันของฉันของ Jurik Filter ฉันใช้ค่าเฉลี่ยง่ายแทนการเฉลี่ยที่ซับซ้อนของ Jurik
นอกจากนี้ ด้วยตัวบ่งชี้แนบ JurikVolty_v1 (รูปที่ 2) คุณสามารถดูค่าของ Volty (VisualMode=0), vSum (VisualMode=1) และ AvgVolty (เส้นประสีแดง).
สูตรสำหรับความผันผวนของราคาคือ Volty = ค่าสูงสุดระหว่าง Abs(del1) และ Abs(del2), ถ้า Abs(del1) = Abs(del2) จะเป็น Volty = 0,
โดยที่: - del1 - ระยะห่างระหว่างราคากับแถบบน del1 = Price - UpperBand - del2 - ระยะห่างระหว่างราคากับแถบล่าง del2 = Price - LowerBand แถบ Jurik แตกต่างจากแถบราคาที่รู้จักอื่นๆ เช่น Bollinger, Keltner, Donchian, Fractal และอื่นๆ: ถ้า del1 > 0 จะเป็น UpperBand = Price มิฉะนั้น UpperBand = Price - Kv*del1 ถ้า del2 < 0 จะเป็น LowerBand = Price มิฉะนั้น LowerBand = Price - Kv*del2,
โดยที่: - Kv - ตัวแปรความผันผวน Kv = bet ^ SquareRoot(pow2). ง่ายที่จะเห็นว่าแถบเหล่านี้สามารถเป็นฐานสำหรับตัวบ่งชี้ติดตามแนวโน้มเช่น Wilder's Parabolic ดังนั้น คุณจะเห็นว่าเราแทบไม่มีจุดที่คลุมเครือในอัลกอริทึมของ Jurik Moving Average (JMA)
สรุป
รีวิวจากลูกค้า
5 | 0 % | |
4 | 100 % | |
3 | 0 % | |
2 | 0 % | |
1 | 0 % |


