
GUPPY-MASTER V3
Indikator
251 unduhan
Versi 1.0, Mar 2026
Windows, Mac
5.0
Ulasan: 3
Sejak 27/02/2026
33.16K
Volume trading
25.96K
Pip dimenangkan
8
Penjualan
391
Instal gratis
Deskripsi
GUPPY TREND MASTER V3 (4X4 TRADING TECHNOLOGY )
Visualisasikan Sentimen Pasar dengan Pelangi 38-EMA
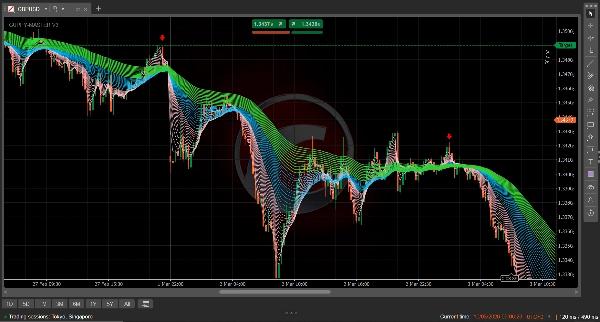
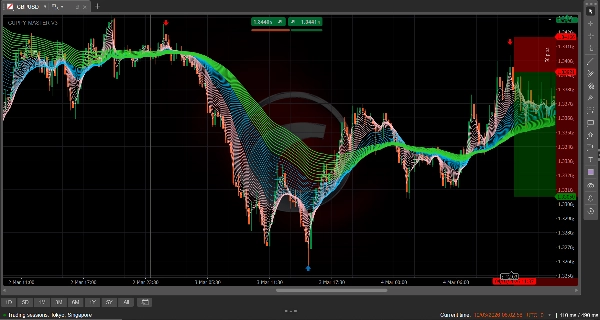
The Guppy Trend Master 4X4 adalah alat analisis teknikal premium untuk cTrader yang mengubah aksi harga yang kompleks menjadi peta psikologi pasar yang jelas dan berwarna. Dengan memplot 38 Exponential Moving Averages (EMA) secara bersamaan, ini memungkinkan trader membedakan antara "noise" sementara dan pembalikan tren yang nyata.
Logika Visual 4X4
Indikator mengorganisir data pasar menjadi tiga "pita" yang berbeda untuk memberi Anda pandangan multi-dimensi tentang tren:
- Pita Merah Muda (Periode 2–15): Kelompok "Spekulator". Garis-garis ini mewakili trader jangka pendek. Ketika mereka melebar, momentum tinggi. Ketika mereka menyempit, pergerakan mulai melelahkan.
- Pita Biru (Periode 17–41): Kelompok "Jembatan". Ini berfungsi sebagai zona transisi kritis. Sering kali menjadi area "pantulan" untuk masuk kembali selama tren yang kuat.
- Pita Hijau (Periode 44–74): Kelompok "Investor". Ini mewakili sentimen jangka panjang. Pita hijau yang lebar dan melebar menunjukkan tren yang kuat dan stabil yang sulit ditembus.
Mengapa Menggunakan Indikator Ini?
- Konfirmasi Tren Instan: Lihat sekilas apakah pasar sedang tren atau bergerak sideways. Jika pita-pita kusut, hindari masuk pasar. Jika mereka melebar dan terpisah, trennya kuat.
- Zona Scalping Presisi: Dioptimalkan khusus untuk timeframe M1 dan M5, 4X4 menyoroti zona "Beli Saat Turun" dan "Jual Saat Naik" dengan akurasi tinggi.
- Visualisasi Volatilitas: "Celah" antara pita memberi tahu Anda seberapa besar keyakinan di balik pergerakan. "Celah jelas" (seperti yang terlihat dalam logika 4X4) menunjukkan lingkungan perdagangan dengan probabilitas tinggi.
- Logika Tanpa Lag: Dengan menggunakan Exponential Moving Averages (EMA), 4X4 bereaksi terhadap perubahan harga lebih cepat daripada indikator Guppy berbasis SMA standar, menjadikannya unggul untuk pasar frekuensi tinggi modern.
Cara Membaca Sinyal
- Kekuatan Bullish: Merah muda di atas, diikuti oleh Biru, dengan Hijau di bawah. Semua kelompok melebar ke atas dengan jarak yang terlihat antara garis-garis.
- Kekuatan Bearish: Hijau di atas, diikuti oleh Biru, dengan Merah muda di bawah. Semua kelompok melebar ke bawah.
- Kepungan: Ketika ketiga kelompok berkumpul menjadi satu titik, breakout besar akan segera terjadi.
Ringkasan
Ringkasan AI
The GUPPY TREND MASTER V3 is a technical analysis indicator designed for the cTrader platform that visualizes market sentiment using 38 Exponential Moving Averages (EMAs). It organizes these EMAs into three color-coded ribbons to provide a multi-dimensional view of market trends: the Pink Ribbon (periods 2–15) reflects short-term speculator activity, the Blue Ribbon (periods 17–41) serves as a transitional bridge zone, and the Green Ribbon (periods 44–74) indicates long-term investor sentiment. This structure helps traders distinguish between market noise and genuine trend reversals.
Key features include instant trend confirmation by observing ribbon separation or entanglement, precision scalping zones optimized for 1- and 5-minute timeframes, and visualization of market volatility through the spacing between ribbons. The use of EMAs ensures faster reaction to price changes compared to traditional SMA-based Guppy indicators, supporting high-frequency trading environments.
Signal interpretation is based on ribbon positioning and spacing: bullish trends show Pink above Blue above Green with upward fanning, bearish trends show the reverse with downward fanning, and convergence of all ribbons signals an imminent breakout. The indicator supports various markets including forex pairs (GBPUSD, USDJPY), cryptocurrencies, stocks, and commodities like gold (XAUUSD).
Profil indikator
Ulasan pelanggan
5.0
Ulasan: 3
5 | 100 % | |
4 | 0 % | |
3 | 0 % | |
2 | 0 % | |
1 | 0 % |
Ulasan pelanggan
March 29, 2026
This is a nice indicator 😀. Overall the images are what is represented on the chart no faking. But only the arrows missing. Let me hope version 2 has them.
March 17, 2026
Very good 👍👍 indicator. Have looked for it every where finally I found it works every well
Diskusi
Pertanyaan umum
Signal
Breakout
Scalping
GBPUSD
Crypto
Stocks
XAUUSD
NAS100
USDJPY
Produk-produk yang tersedia melalui cTrader Store, termasuk bot trading, indikator, dan plugin, disediakan oleh pengembang pihak ketiga serta hanya ditujukan untuk akses teknis dan informasi. cTrader Store bukan broker dan tidak menyediakan saran investasi, rekomendasi pribadi, atau jaminan apa pun tentang kinerja di masa mendatang.
Produk lain dari penulis ini


Harga
Sejak 27/02/2026
33.16K
Volume trading
25.96K
Pip dimenangkan
8
Penjualan
391
Instal gratis