
ICT Order Block
Indikator
704 unduhan
Versi 1.0, Nov 2025
Windows, Mac
3.5
Ulasan: 2
Deskripsi
Blok Pesanan ICT - Blok Pesanan Institusional
Secara otomatis mengidentifikasi blok pesanan institusional pada grafik Anda. Visualisasikan zona kunci di mana harga bisa bereaksi.
Apa yang Dilakukan
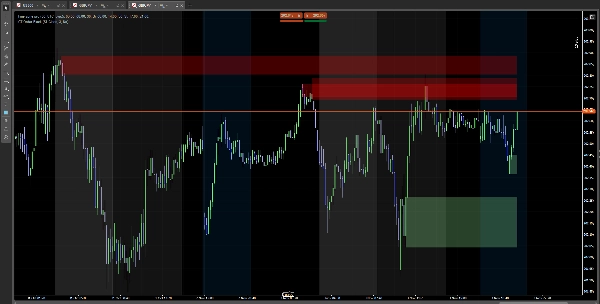
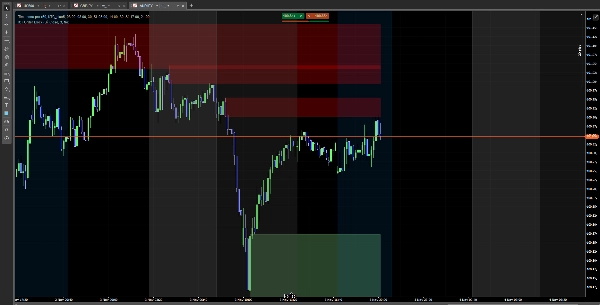
✅ Mendeteksi blok bullish (zona pembelian institusional) ✅ Mendeteksi blok bearish (zona penjualan institusional) ✅ Menampilkan persegi panjang berwarna pada zona penting ✅ Blok menghilang saat harga menembusnya
Cara Menggunakannya
Instalasi Sederhana
- Unduh indikator
- Tambahkan ke grafik Anda di cTrader
- Selesai! Anda akan melihat blok secara otomatis
Konfigurasi
Pengaturan Utama
- Tampilkan SCOB: Tampilkan atau sembunyikan blok
- Metode Mitigasi:
-
- Tutup: Blok menghilang saat candle ditutup
- Sumbu: Blok menghilang saat tersentuh
- Tampilkan SCOB Terakhir X: Berapa banyak blok yang ditampilkan (1-15)
- Terapkan Filter Volatilitas: Saring blok berdasarkan volatilitas
Warna
- Warna Bullish: Warna untuk blok bullish (hijau muda secara default)
- Warna Bearish: Warna untuk blok bearish (merah secara default)
- Sesuaikan transparansi dengan pemilih warna
Interpretasi
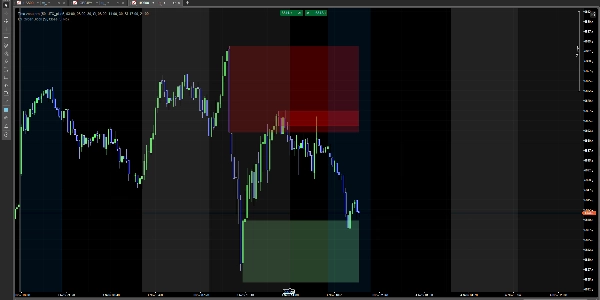
🟢 Blok Hijau (Bullish): Zona dukungan potensial 🔴 Blok Merah (Bearish): Zona resistensi potensial
Catatan: Ini adalah indikator analisis teknikal. Gunakan dengan manajemen risiko yang tepat.
Ringkasan
Ringkasan AI
ICT Order Block is a technical analysis indicator designed for use on cTrader charts. It automatically identifies institutional order blocks, highlighting key price zones where market reactions may occur. The indicator detects bullish order blocks (potential institutional buying zones) and bearish order blocks (potential institutional selling zones), displaying them as colored rectangles—green for bullish support areas and red for bearish resistance areas. These blocks visually represent important supply and demand zones that traders can monitor.
Key features include automatic block detection, configurable display options such as the number of blocks shown (1–15), and a volatility filter to refine block selection. Users can choose how blocks disappear: either when a candle closes beyond the block or when the block is touched by price wicks. Color customization and transparency adjustments are also available for better chart integration.
Installation involves adding the indicator to a cTrader chart, after which the blocks appear automatically. This tool supports analysis across Forex, Indices, and Cryptocurrency markets. It serves as a visual aid for identifying potential support and resistance zones based on institutional trading activity and should be used alongside proper risk management practices.
Profil indikator
Ulasan pelanggan
3.5
Ulasan: 2
5 | 50 % | |
4 | 0 % | |
3 | 0 % | |
2 | 50 % | |
1 | 0 % |
Ulasan pelanggan
January 27, 2026
the zones are blocking the candles, zones need to be behind the candles .other than that it is good
Diskusi
Pertanyaan umum
Forex
Indices
Crypto
Produk-produk yang tersedia melalui cTrader Store, termasuk bot trading, indikator, dan plugin, disediakan oleh pengembang pihak ketiga serta hanya ditujukan untuk akses teknis dan informasi. cTrader Store bukan broker dan tidak menyediakan saran investasi, rekomendasi pribadi, atau jaminan apa pun tentang kinerja di masa mendatang.


Harga
Sejak 24/02/2025
15
Penjualan
1.81K
Instal gratis