

Описание
BB20 Мультиколор
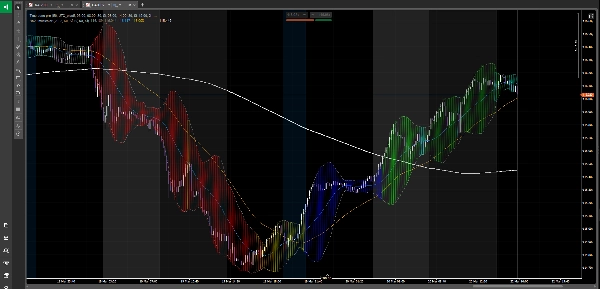
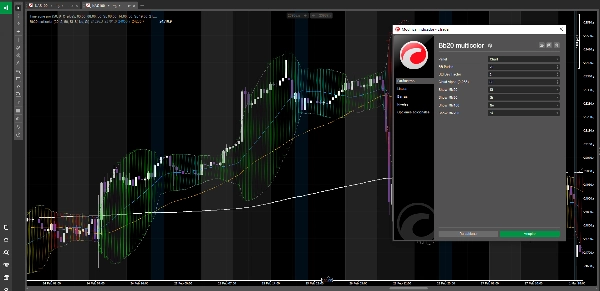
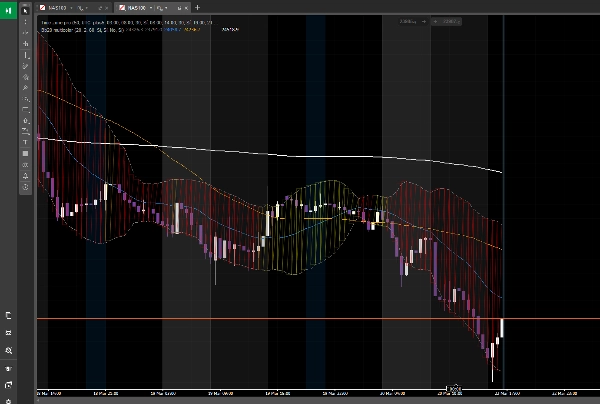
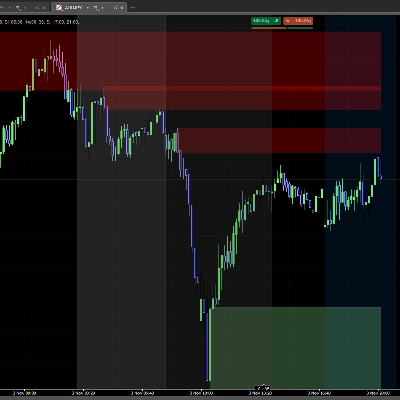
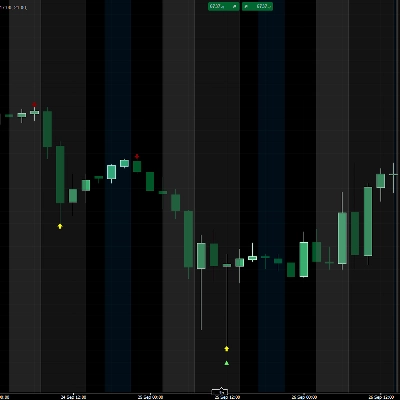
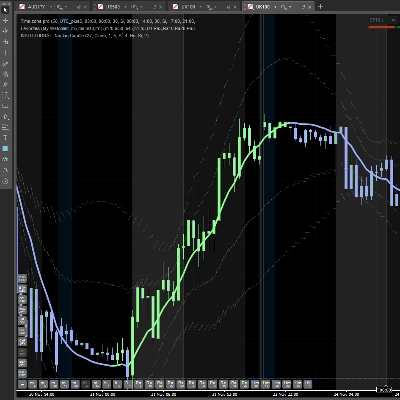
Мощный индикатор определения рыночного цикла, который накладывается непосредственно на ваш график, раскрашивая ценовое движение в 8 различных рыночных состояний — от глубокого медвежьего до полностью бычьего — используя взаимосвязь между ценой и четырьмя ключевыми скользящими средними (MM20, MM50, MM100, MM200) в сочетании с полосами Боллинджера.
──────────────────────────
КАК ЭТО РАБОТАЕТ
──────────────────────────
Индикатор постоянно оценивает положение цены относительно четырёх скользящих средних и присваивает одной из 8 цветов зону облака полос Боллинджера, давая вам мгновенное визуальное представление о текущей стадии рыночного цикла:
🔴 КРАСНЫЙ — Явный медвежий тренд
Цена ниже MM200. Рынком доминируют продавцы. Смещение: только шорт.
🟠 ОРАНЖЕВЫЙ — Технический отскок
Цена ниже MM200, но восстановилась выше MM20. Отскок в рамках медвежьего тренда — не разворот. Распространённая зона бычьей ловушки.
🟡 ЖЁЛТЫЙ — Фаза цикла 1
Цена пересекла MM50 вверх, но скользящие средние всё ещё медвежьи. Первые признаки восстановления, ещё не подтверждённые.
🔵 СИНИЙ — Попытка разворота тренда
MM100 и MM50 ниже MM200, но цена начинает подниматься между ними. Зона перехода с высокой волатильностью — наблюдайте внимательно.
⬜ СЕРЫЙ — Нейтральный / ослабление
Цена выше MM200, но ниже MM100. Долгосрочная структура всё ещё бычья, но импульс слабеет. Зона осторожности.
🟢 ЛАЙМОВО-ЗЕЛЁНЫЙ — Фаза цикла 2
Цена и MM50 выше MM200. Подтверждается новый бычий цикл. Многие институциональные трейдеры начинают позиционироваться здесь.
🪵 БИРЮЗОВЫЙ — Здоровая консолидация
Цена выше MM200 и MM100, но отступает к MM50 или MM20. Нормальная пауза в рамках бычьего тренда — потенциальная зона повторного входа.
🌲 ТЁМНО-ЗЕЛЁНЫЙ — Зрелый бычий цикл
Все скользящие средние полностью выстроены: MM200 < MM50 < MM20 < Цена. Самая чистая трендовая среда. Минимальное сопротивление вверх.
──────────────────────────
ОСОБЕННОСТИ
──────────────────────────
• Облака зон отрисовываются нативно с помощью Chart.DrawTriangle в cTrader для плавных, профессионально выглядящих заливок
• Полосы Боллинджера (верхняя и нижняя) отображаются вместе с облаком
• Все четыре скользящие средние можно включать и отключать по отдельности (MM20, MM50, MM100, MM200)
• Настраиваемый период BB, коэффициент стандартного отклонения и прозрачность облака
• Работает на любом инструменте и любом таймфрейме
• Полностью открытый исходный код — навсегда бесплатно
──────────────────────────
КАК ИСПОЛЬЗОВАТЬ
──────────────────────────
1. Используйте цвет как фильтр рыночного контекста перед совершением сделки
2. Ищите длинные позиции только когда фон зелёный (лаймовый или тёмный)
3. Ищите короткие позиции только когда фон красный или оранжевый
4. Используйте жёлтый, синий и серый как переходные зоны — уменьшайте размер позиции или ждите подтверждения
5. Бирюзовый — ваша зона повторного входа в устоявшемся бычьем тренде
Совместим с любой торговой стратегией. Особенно эффективен в сочетании с анализом ценового действия, объёмов или подходами, основанными на настроениях.
Установите его, добавьте на график и мгновенно узнайте, на какой фазе находится рынок.
⚠️ ОТКАЗ ОТ ОТВЕТСТВЕННОСТИ
Торговля финансовыми инструментами связана с риском и подходит не всем. Всегда проводите собственный анализ, тщательно управляйте рисками и никогда не торгуйте деньгами, которые не можете позволить себе потерять.
Этот индикатор является инструментом технического анализа — а не финансовой консультацией. Используйте его с умом.
Сводка
- Red: Clear bearish trend (price below MM200)
- Orange: Technical bounce within bearish trend
- Yellow: Early recovery signs (price above MM50, but MAs bearish)
- Blue: Trend reversal attempt with high volatility
- Gray: Neutral or weakening momentum (price above MM200 but below MM100)
- Lime Green: Confirmed new bullish cycle (price and MM50 above MM200)
- Teal: Healthy consolidation in bullish trend (price above MM200 and MM100, pulling back)
- Dark Green: Mature bullish cycle with aligned moving averages
Features include native cloud rendering using cTrader's Chart.DrawTriangle, toggleable moving averages, configurable Bollinger Bands parameters, and compatibility with any instrument and timeframe. The indicator is open source and free to use. It serves as a market context filter to guide trade decisions, recommending long positions in green zones and shorts in red/orange zones, with caution advised in transition colors. It complements various trading strategies, including price action and volume analysis.
Отзывы покупателей
Обсуждение
Частые вопросы






















Цена