
Daily Fibo
インジケーター
207 ダウンロード数
バージョン 2.0、Jun 2026
Windows、Mac
4.5
レビュー: 2
説明
デイリー平均フィボナッチ - 自動デイリーフィボナッチレベル
当日の始値からのフィボナッチレベルで平均日次レンジを投影します
このインジケーターは何をしますか?
デイリー平均フィボナッチは、平均日次レンジに基づいてフィボナッチレベルを自動的に描画します。毎日、インジケーターは始値から上下に重要なレベルを投影し、潜在的なターゲットや反転ゾーンの特定を支援します。
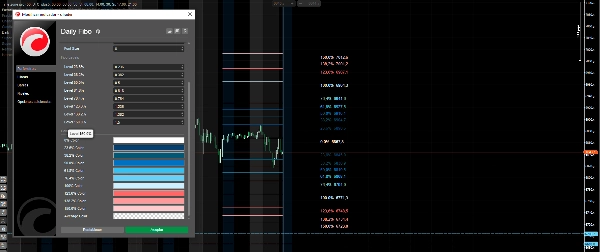
主な特徴
✅ 自動日次更新 - レベルは毎日自動的に再描画されます ✅ カスタマイズ可能なレベル - 最大8つの異なるフィボナッチレベルを設定可能 ✅ カスタムカラー - 各レベルは識別可能な独自の色を持ちます ✅ 価格付きラベル - 各レベルのパーセンテージと正確な価格を表示 ✅ 調整可能な日数平均 - 平均計算に使用する日数を選択可能(デフォルト20日)
デフォルトで含まれるレベル
- 0% - 当日の始値(基準線)
- 23.6%、38.2%、50%、61.8%、76.4% - 内部の戻りと拡張
- 100% - 完全な平均レンジ
- 123.6%、138.2%、150% - 外部の拡張
インジケーターの使い方
- 方向を特定する - 始値(0%)が基準点です
- 強気のターゲットを探す - 上部のレベルは買い目標を示します
- 弱気のターゲットを探す - 下部のレベルは売り目標を示します
- 反転ゾーン - 価格が極端なレベル(100%以上)に達したとき、反転の可能性を探します
調整可能なパラメーター
- 平均計算に使用する日数
- カスタムフィボナッチレベル
- レベルごとの個別カラー
- ラベルと価格の表示/非表示
- フォントサイズ
トレーディングセッション中に明確なターゲットと可能な価格ゾーンを求めるトレーダーに最適です。
概要
AIによる概要
Daily Fibo is an indicator that automatically projects Fibonacci levels based on the average daily price range, starting from the day's opening price. It redraws these levels each trading day to help identify potential price targets and reversal zones. The indicator includes up to eight customizable Fibonacci levels, ranging from 0% (day's opening) through common retracements (23.6%, 38.2%, 50%, 61.8%, 76.4%) to full and extended ranges (100%, 123.6%, 138.2%, 150%). Each level can be assigned a distinct color and labeled with both the percentage and exact price for clarity. Users can adjust parameters such as the number of days used to calculate the average range, visibility of labels, and font size. This tool supports markets including Forex, Indices, Crypto, and Stocks. Traders can use Daily Fibo to identify bullish and bearish targets relative to the opening price and to anticipate possible reversal points when prices reach extreme Fibonacci extensions.
インジケーターのプロフィール
カスタマーレビュー
4.5
レビュー: 2
5 | 50 % | |
4 | 50 % | |
3 | 0 % | |
2 | 0 % | |
1 | 0 % |
カスタマーレビュー
ディスカッション
よくあるご質問
Forex
Indices
Crypto
Stocks
cTrader Storeで入手可能な取引ボット、インジケーター、プラグインなどの商品は、第三者の開発者が提供するものであり、情報と技術の取得のみを目的としてご利用いただけます。cTrader Storeはブローカーではなく、投資助言や個人的な推奨を行うことも、将来のパフォーマンスを保証することもありません。


![「High-Low Divergence [Iridio Capital]」ロゴ](https://cdn.ctrader.com/image/webp/443c4661-7abb-40f1-842f-4b6ec560649b_40914)


価格
登録日 24/02/2025
15
販売
1.81K
無料インストール