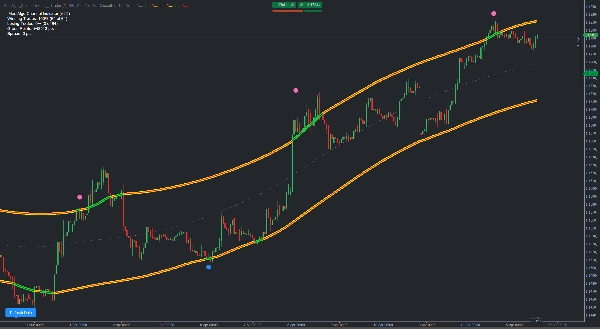
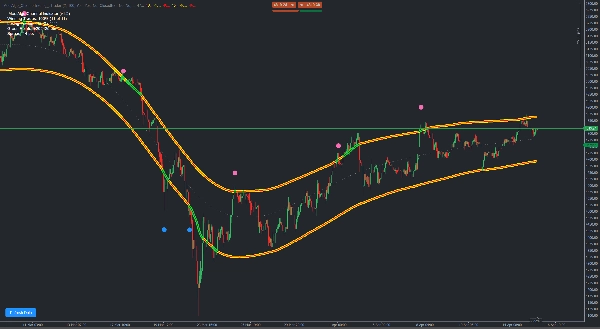
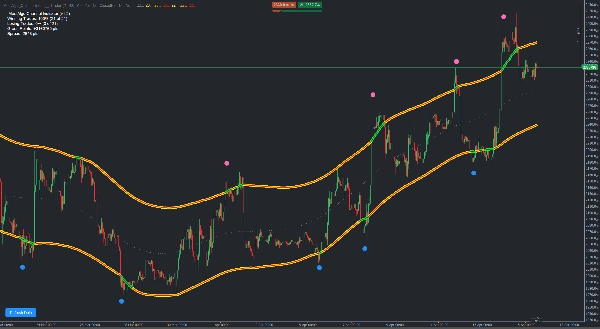
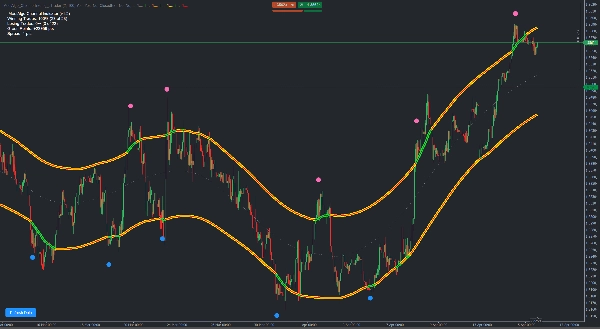
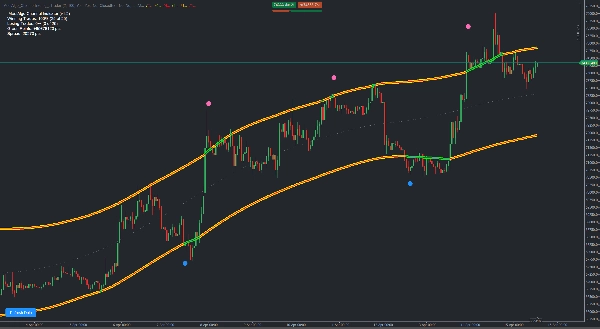
「MeetAlgo_ChannelTrading_cTrader」ロゴ
MeetAlgo_ChannelTrading_cTrader
5.0
03/09/2025
81
Desktop

MeetAlgo Channel Trading is a volatility-based indicator built using envelope theory. The indicator plots dynamic upper and lower bands based on recent price movement and statistical deviation. These bands aim to represent expected price boundaries, and values plotted outside the range may signal a shift in volatility.

The channel is designed to reflect general market behavior by identifying price areas that are relatively high or low. When price approaches or exceeds the upper or lower bands, a directional arrow is plotted to suggest potential reversal zones. These signals can be interpreted in combination with other forms of analysis.

The band width adapts to changing volatility, providing flexibility during different market conditions. The core method reduces lag by using a custom smoothing formula based on average price range.


Parameters Configurations

  • Deviations: Adjusts the sensitivity of the bands to volatility.
  • Minimum Bar Redraw: Sets the number of bars required before recalculating the channel.
  • Show Analysis Report: Displays historical signal-based outcome statistics.

Notifications

  • Signal Bar: Select whether calculations are based on live or closed bars.
  • Pop-Up Alerts: Displays message alerts on the platform.
  • Email Alerts: Sends email messages (requires setup in the platform).
  • Push Alerts: Sends mobile alerts (requires platform configuration).
  • Sound Alerts: Plays audio alerts from the cTrader Sounds folder.
  • Sound File Names: Names of sound files to use for directional signals.


これも好きかも
RT True Strength Index
Enhance trading with TSI! Use the True Strength Index for clear insights into market momentum and trend strength.
インジケーター
breakout
signal
stocks
Darvas Box
The Darvas Box involves identifying "boxes" or trading ranges where a stock's price consolidates before breaking out.
ICT Killzone and Sessions high_low
This indicator is an essential tool for traders seeking to visualize key trading sessions on their charts.
Market Polarity Zones
implifies market analysis by automatically identifying bullish 🚀 or bearish 🐻 phases and marking key levels where ....
On Balance Volume USD - Combined
See USD demand in one line—Composite OBV fuses six major FX pairs into a clear momentum gauge.
インジケーター
breakout
commodities
xauusd
+1
ZigzagSR
Automatic ZigZag swings with dynamic support & resistance levels, labeling highs/lows for clear trend signals.
VolumeColorBar
Color Volume Bars – Visualize Market Strength Instantly
Volume Weighted Average Price
VWAP is a powerful tool for intraday traders
インジケーター
rsi
signal
scalping
+1
Long Wick
Identify potential reversal points in the market by detecting candles with exceptionally long upper or lower wicks
インジケーター
forex
indices
crypto
+4
MACD Pro Trader
🚀 MACD Pro Trader – Advanced MACD with buy/sell signals, custom MAs & color-coded histograms for smarter trading! 📈🔥
Repiptor BB Width
Bollinger Bands Width
Fx4U.Multi TimeFrame Support & Resistance
Allow trader to visualize Support & Resistance across different timeframes,give trader an overview of the current market
Fury Team E_M_A_su_TF
EMA ON TF (MULTI-TIMEFRAME)
Zero Lag MACD
Zero Lag MACD delivers ultra-responsive trend and divergence signals with minimal lag, empowering timely Forex entries.
IVB 2.0
IVB 2.0 is an indicator that works on the strategy of imbalance of the maximum volatility box of indices
Zero Lag Exponential Moving Average
ZLEMA (Zero Lag EMA) is a faster, smoother version of EMA, ideal for capturing quick market shifts and trends.
インジケーター
breakout
supertrend
rsi
Zig-Zag Extremity Tracker
Dynamically adjusts regression channels based on ZigZag extremes, resetting when price breaks bands to track real trends
インジケーター
breakout
bollinger
signal
[Hamster-Coder] Bollinger Bands
Bolliger Bands + Hamster-Coder™ Timeframe Decoupling