
Descrição
Showcase:
Market Cipher B é um indicador de análise técnica poderoso e fácil de usar, projetado para ajudá-lo a tomar decisões de negociação confiantes em mercados financeiros – desde criptomoedas até ações e forex. Seja você um iniciante ou um trader experiente, este oscilador oferece sinais claros de compra e venda, dando a você a vantagem necessária para navegar em mercados voláteis com facilidade.
Por que escolher o Market Cipher B?
1. Sinais Claros de Compra e Venda O indicador identifica pontos ótimos de entrada e saída com sinais fáceis de entender. Pontos verdes indicam oportunidades de compra, enquanto pontos vermelhos indicam quando vender. Isso torna simples para qualquer pessoa agir rápida e decisivamente, mesmo sem conhecimento técnico aprofundado.
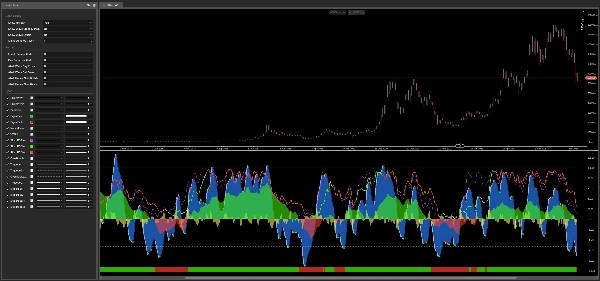
2. Ondas Azuis – Momento do Mercado de Relance O Market Cipher B usa duas linhas dinâmicas de ondas azuis que revelam se o mercado está ganhando força ou perdendo impulso. Seus cruzamentos destacam momentos-chave para capturar tendências emergentes ou evitar perdas potenciais. O sistema de ondas forma o motor principal do indicador, fornecendo uma base confiável para todos os outros sinais.
3. Spread do Momento das Ondas – Sua Bússola Direcional A linha amarela representa o spread entre as duas ondas azuis, atuando como um medidor de momento em tempo real. Quando sobe acima de zero, os compradores estão no controle; quando cai abaixo, os vendedores dominam. Isso ajuda você a determinar instantaneamente se uma tendência tem força por trás dela ou está se aproximando de exaustão e possível reversão.
4. Fluxo de Dinheiro – Acompanhe Para Onde Vai o Dinheiro A linha de Fluxo de Dinheiro verde e vermelha revela para onde os investidores estão direcionando seu capital. Calculada como um oscilador suavizado ao longo de 60 períodos, ela mostra quando players institucionais ou de grande escala estão entrando ou saindo do mercado. Cruzamentos acima e abaixo da linha zero são particularmente significativos, frequentemente precedendo grandes movimentos de preço e dando a você uma vantagem significativa.
5. Barra MFI – Sinal Instantâneo de Fluxo de Capital Uma barra codificada por cores exibida na parte inferior do painel do indicador fornece uma visualização rápida da direção atual do Fluxo de Dinheiro. Uma barra verde sinaliza domínio do capital comprador, enquanto uma barra vermelha indica pressão vendedora. As transições de cor na barra destacam reversões potenciais de tendência imediatamente, sem necessidade de análise numérica – tornando-a uma das pistas visuais mais rápidas disponíveis no indicador.
6. RSI Estocástico – Precisão no Tempo Uma linha roxa de RSI Estocástico, combinada com linhas de RSI mais lentas verde e vermelha, ajuda você a identificar condições de mercado sobrecompradas (potencialmente supervalorizadas) ou sobrevendidas (potencialmente subvalorizadas) com alta precisão. O design de velocidade dupla – uma linha rápida (40 períodos) e uma linha lenta (81 períodos) – permite distinguir entre ruído de curto prazo e mudanças genuínas de momento, tornando-o ideal para encontrar pontos de reversão de alta probabilidade e evitar armadilhas comuns do mercado.
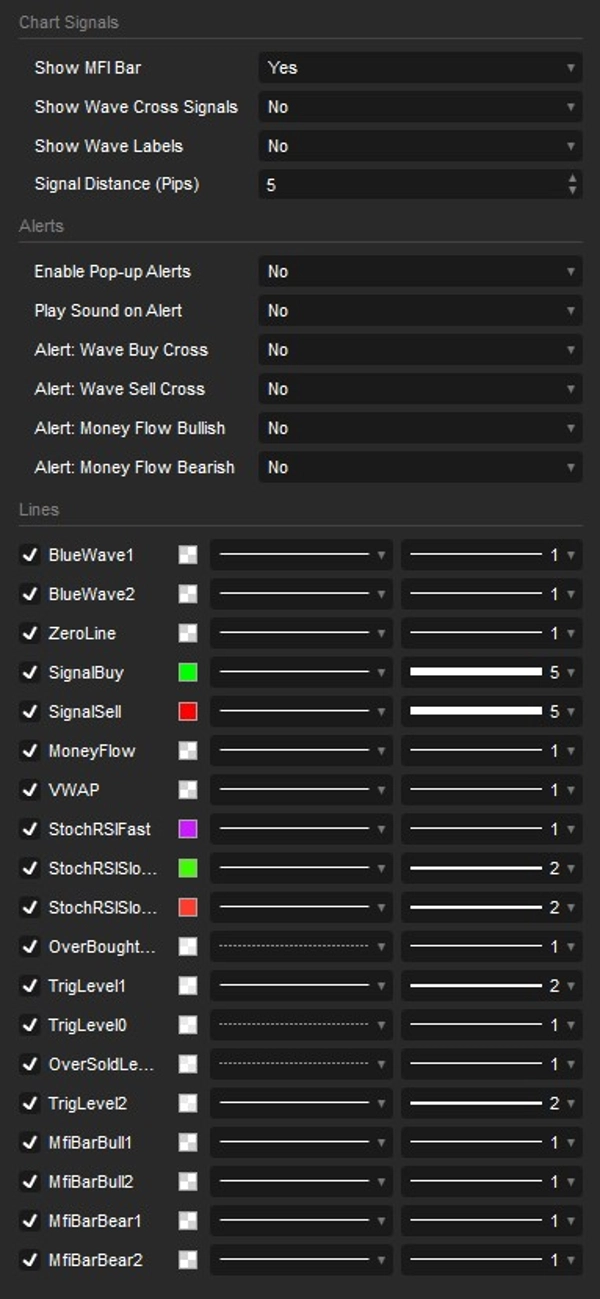
7. Sistema de Alerta Inteligente – Nunca Perca um Sinal O Market Cipher B inclui um sistema de notificações totalmente configurável que mantém você informado mesmo quando está longe da tela. Você pode ativar ou desativar independentemente alertas pop-up e notificações sonoras para quatro eventos principais: Cruzamento de Compra da Onda, Cruzamento de Venda da Onda, Fluxo de Dinheiro cruzando acima de zero (Alta) e Fluxo de Dinheiro cruzando abaixo de zero (Baixa). Cada tipo de alerta pode ser alternado separadamente, dando a você controle total sobre o que é mais importante para sua estratégia de negociação.
8. Flexibilidade e Personalização O Market Cipher B funciona perfeitamente em qualquer mercado e período disponível no cTrader – desde gráficos de scalping de um minuto até visões semanais de swing trading. Você tem controle total sobre quais componentes são exibidos, incluindo a Barra MFI, sinais de cruzamento das ondas, rótulos de sinal (texto Comprar/Vender diretamente no gráfico de preços) e todos os tipos de alerta. Essa modularidade significa que você pode adaptar o indicador para combinar exatamente com seu estilo de negociação sem poluição visual.
Para quem é o Market Cipher B?
Novos Traders apreciarão os sinais intuitivos de compra/venda, visuais codificados por cores e níveis de referência claros que facilitam o início da negociação sem exigir anos de experiência em análise técnica. O indicador comunica suas conclusões visualmente, para que você passe menos tempo lendo números e mais tempo agindo sobre as oportunidades.
Investidores Experientes encontrarão valor nos componentes avançados – Fluxo de Dinheiro, Spread do Momento das Ondas e o RSI Estocástico duplo – que juntos fornecem uma visão em múltiplas camadas da estrutura do mercado adequada para estratégias sofisticadas e de alta convicção.
Traders de Day e Swing se beneficiam da flexibilidade de períodos do indicador e da rápida geração de sinais, permitindo que capitalizem tanto movimentos intradiários rápidos quanto tendências direcionais de longo prazo sem precisar alternar entre várias ferramentas.
Resumo
Additional components include a Money Flow line that tracks capital movement by large investors, accompanied by a color-coded Money Flow bar for quick visual cues on market pressure. A dual-speed Stochastic RSI helps identify overbought and oversold conditions, aiding in precise timing for potential reversals.
Market Cipher B supports full customization, allowing users to enable or disable specific features and alerts for key events such as wave crosses and Money Flow shifts. It operates on any timeframe, from minute charts to weekly views, making it suitable for new traders, experienced investors, day traders, and swing traders. The indicator integrates multiple analytical tools into one interface, aiming to provide a comprehensive market overview and assist in making informed trading decisions.
Avaliações de clientes
5 | 67 % | |
4 | 33 % | |
3 | 0 % | |
2 | 0 % | |
1 | 0 % |


