
Descrição
MACD Custom MTF (Multiple Time Frame) v1.1 é uma ferramenta avançada que combina o poder comprovado do clássico MACD com a vantagem crítica da análise multi-temporal e visualização moderna e intuitiva. Projetada para traders exigentes que buscam precisão, interpretação rápida e a capacidade de adaptar ferramentas à sua estratégia única.
Novidades na Versão 1.1:
- Visuais 100% Suaves: Corrigidas linhas MACD quebradas/descontínuas – as linhas agora são perfeitamente contínuas durante mudanças de tendência.
- Melhor Visibilidade: Aumentado o tamanho dos pontos de sinal de Compra/Venda, engrossada a Linha de Sinal e o Histograma para uma visão cristalina. Linha Zero esmaecida para reduzir o cansaço visual.
- Alertas Inteligentes e Simplificados: Janela de configurações limpa. Basta ativar "Alerta de Compra" ou "Alerta de Venda" e o indicador gerencia automaticamente os Popups na tela e as notificações sonoras corretas.
- Configurações Organizadas: Todos os parâmetros agora estão lindamente agrupados em categorias intuitivas para uma experiência de usuário muito melhor.
- Localização Completa em Inglês: Todas as mensagens de log, popups e erros foram totalmente localizados para o inglês.
Análise Multi-Temporal (MTF) em um Único Gráfico:
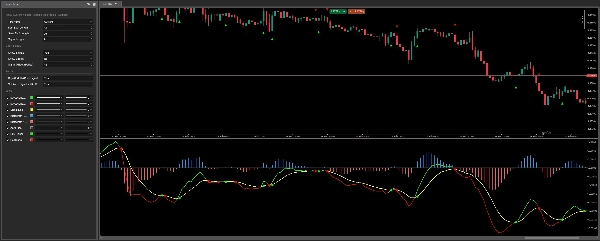
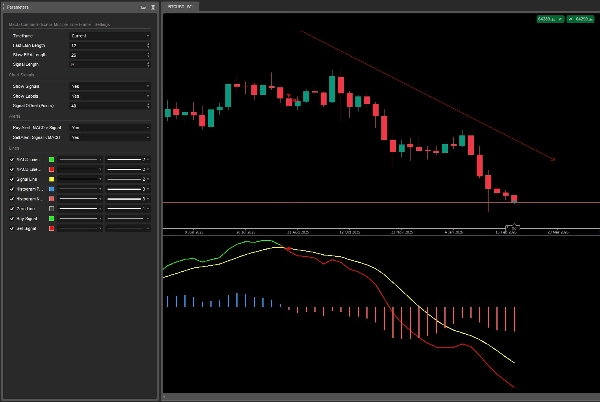
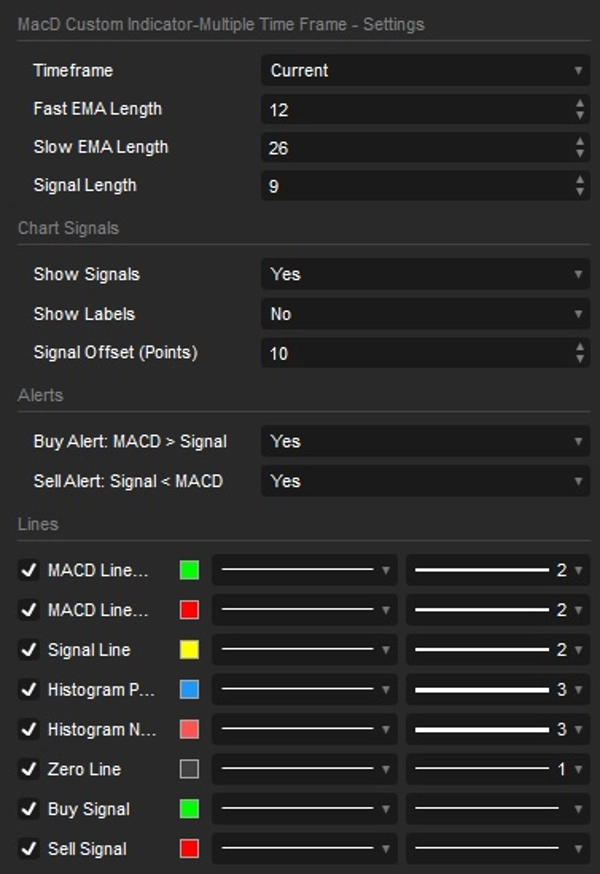
Pare de ficar trocando de gráfico! Exiba dados MACD de um timeframe superior (ex.: H1, H4, D1) diretamente no seu gráfico atual de trabalho (ex.: M5, M15). Ganhe um contexto de mercado mais amplo e inestimável, identifique tendências dominantes subjacentes e filtre efetivamente ruídos enganosos de timeframes inferiores. Totalmente configurável – escolha entre uma lista abrangente de timeframes, de minutos a mensal.
Coloração Dinâmica da Linha MACD e da Linha de Sinal:
Confirmação instantânea de tendência: A linha MACD muda de cor dinamicamente ao cruzar sua linha de sinal, ilustrando vividamente o momentum de alta ou baixa. Sem mais suposições – a cor da linha indica imediatamente se o MACD está acima (alta) ou abaixo (baixa) da sua linha de sinal.
Histograma Cristalino:
Visualize facilmente a divergência (força) entre o MACD e sua linha de sinal. O indicador colore intuitivamente barras engrossadas com base em serem positivas (azul) ou negativas (vermelho), proporcionando uma visão profunda das mudanças de momentum num único olhar.
Sinais Visuais de Cruzamento Inconfundíveis:
Nunca perca um cruzamento crítico novamente! O indicador destaca automaticamente os cruzamentos da linha MACD/Sinal. Ele plota pontos distintos e altamente visíveis diretamente no seu gráfico de preços (com um deslocamento ajustável) e oferece rótulos de texto opcionais "Compra"/"Venda" para máxima clareza.
Alertas Inteligentes Integrados:
Possui notificações Popup e Sonoras integradas e sem complicações para sinais de Compra e Venda. Fique informado de todas as oportunidades sem precisar ficar grudado na tela! Basta ativar os alertas nas configurações e deixar o indicador cuidar da observação para você.
Personalização Completa ao Seu Alcance:
- Personalize os comprimentos do EMA Rápido, EMA Lento e da Linha de Sinal conforme suas especificações precisas.
- Todas as configurações estão organizadas em grupos lógicos (Configurações MACD, Sinais do Gráfico, Alertas) para ajustes rápidos.
- Ative ou desative a visibilidade de elementos visuais individuais: linhas MACD & Sinal, Histograma, Sinais de Cruzamento e Rótulos.
- Deslocamento de sinal ajustável para combinar perfeitamente com a estética e preferências do seu gráfico.
Resumo
Key features include dynamic coloring of the MACD and signal lines to indicate bullish or bearish momentum, a crystal-clear histogram that visualizes the divergence between MACD and its signal line with color-coded bars, and unmistakable visual crossover signals marked by distinct dots or arrows on the price chart. The indicator supports integrated alerts with popup and sound notifications for buy and sell signals, configurable via a streamlined settings interface.
Users can fully customize the indicator by adjusting Fast EMA, Slow EMA, and Signal Line lengths, toggling visibility of visual elements (lines, histogram, signals, labels), and modifying colors and line thickness. The settings are organized into intuitive categories for ease of use. This indicator supports a wide range of timeframes from minutes to monthly and is suitable for various markets including Forex, indices, commodities, stocks, and cryptocurrencies.
Avaliações de clientes
5 | 100 % | |
4 | 0 % | |
3 | 0 % | |
2 | 0 % | |
1 | 0 % |


