
Supertrend - Multi-Timeframe
Indicador
1 compras
Versão 1.0, Oct 2025
Windows, Mac
4.5
Avaliações: 2
Descrição
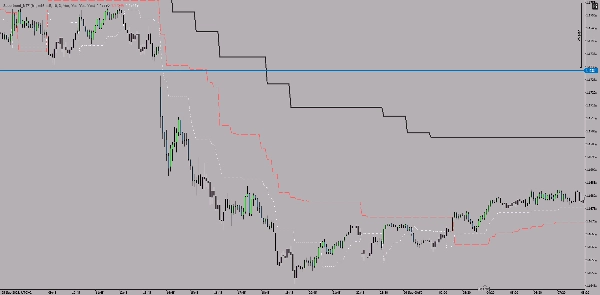
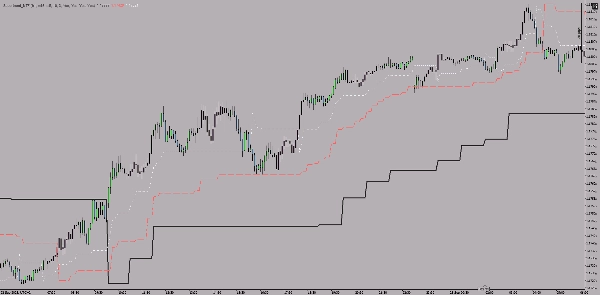
Este é um indicador Supertrend Multi-TimeFrame para a plataforma cTrader que exibe linhas Supertrend de três diferentes períodos simultaneamente em um único gráfico.
Principais Características
Exibição Paralela de Três Períodos:
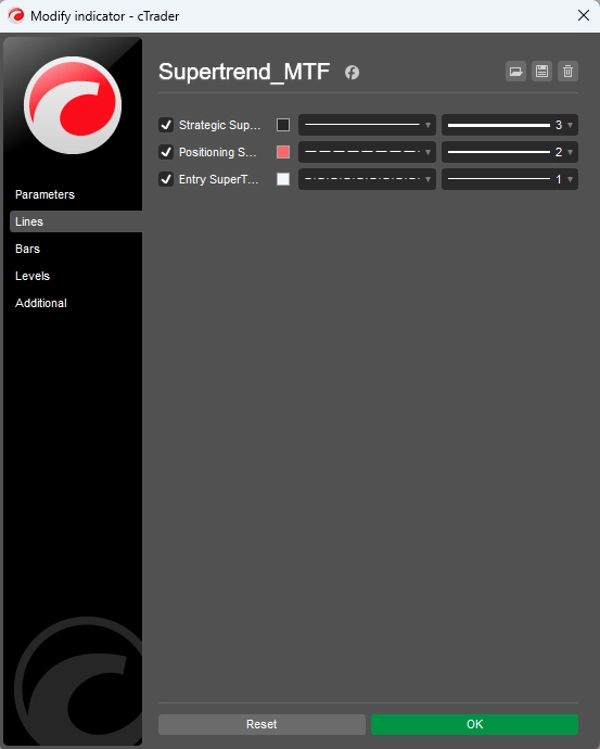
- Período estratégico (padrão: 1 hora) - linha grossa e sólida
- Período de posicionamento (padrão: 15 minutos) - linha de espessura média, tracejada
- Período de entrada (padrão: 5 minutos) - linha fina e pontilhada
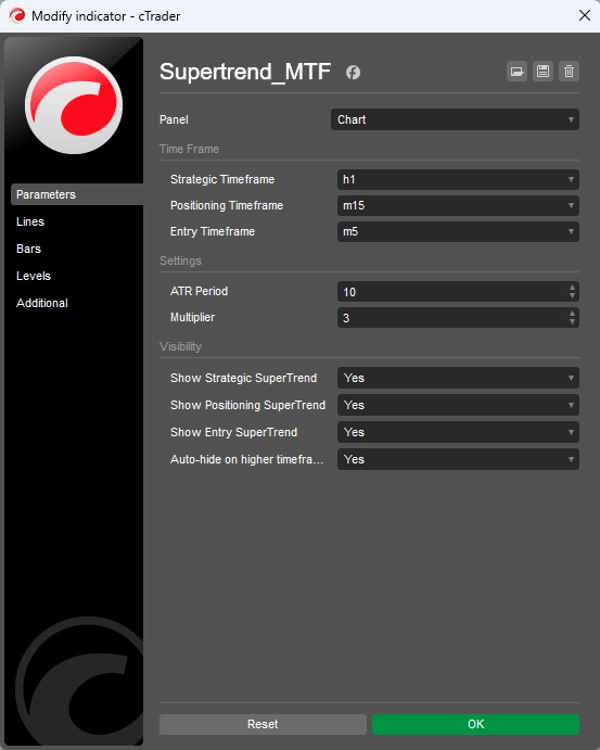
Configurações Personalizáveis:
- Período ATR (padrão: 10)
- Multiplicador (padrão: 3.0)
- Cada um dos três períodos pode ser ativado/desativado individualmente
- Ocultação automática em períodos maiores (opcional)
Como Funciona
O indicador usa a lógica clássica do Supertrend para os três períodos, onde:
- A tendência é de alta quando o preço está acima da linha Supertrend
- A tendência é de baixa quando o preço está abaixo da linha Supertrend
- Diferentes espessuras e estilos de linha ajudam a distinguir entre os períodos
Objetivo
Auxilia na análise multi-temporal: o período maior fornece a direção principal (estratégia), o intermediário refina o posicionamento e o menor marca pontos específicos de entrada.
Resumo
Resumo de IA
The Supertrend - Multi-Timeframe Indicator for the cTrader platform displays Supertrend lines from three distinct timeframes simultaneously on a single chart. It features a strategic timeframe (default 1 hour) shown as a thick solid line, a positioning timeframe (default 15 minutes) as a medium dashed line, and an entry timeframe (default 5 minutes) as a thin dotted line. Each timeframe can be individually enabled or disabled, with customizable settings including ATR period and multiplier. The indicator applies classic Supertrend logic: the trend is considered up when the price is above the Supertrend line and down when below. Different line styles and thicknesses visually distinguish the timeframes. This tool supports multi-timeframe analysis by providing the main directional trend from the larger timeframe, refined positioning from the middle timeframe, and specific entry points from the smallest timeframe. It is applicable across various markets including Forex, indices, commodities, stocks, and cryptocurrencies, and supports symbols such as BTCUSD, EURUSD, GBPUSD, XAUUSD, NAS100, and USDJPY.
Perfil do indicador
Avaliações de clientes
4.5
Avaliações: 2
5 | 50 % | |
4 | 50 % | |
3 | 0 % | |
2 | 0 % | |
1 | 0 % |
Avaliações de clientes
October 13, 2025
The part worth keeping is the setup needs a cleaner reason to exist, and a few ugly trades are useful in the sample.
October 10, 2025
Conversa
Perguntas frequentes
BTCUSD
Forex
Breakout
Indices
EURUSD
Commodities
GBPUSD
NZDUSD
Prop
Scalping
Crypto
Stocks
XAUUSD
NAS100
USDJPY
Os produtos disponíveis através da cTrader Store, incluindo bots de negociação, indicadores e plugins, são fornecidos por programadores terceiros e são disponibilizados apenas para fins informativos e de acesso técnico. A cTrader Store não é um corretor e não fornece aconselhamento em matéria de investimento, recomendações pessoais ou qualquer garantia de desempenho no futuro.


Preço
Desde 05/01/2025
14
Vendas