
VolumeColorBar
Indikator
10 käufe
Version 1.2, Apr 2026
Windows, Mac
4.3
Bewertungen: 3
Beschreibung
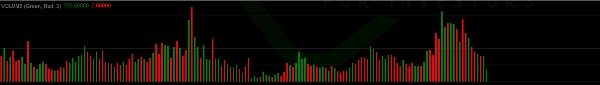
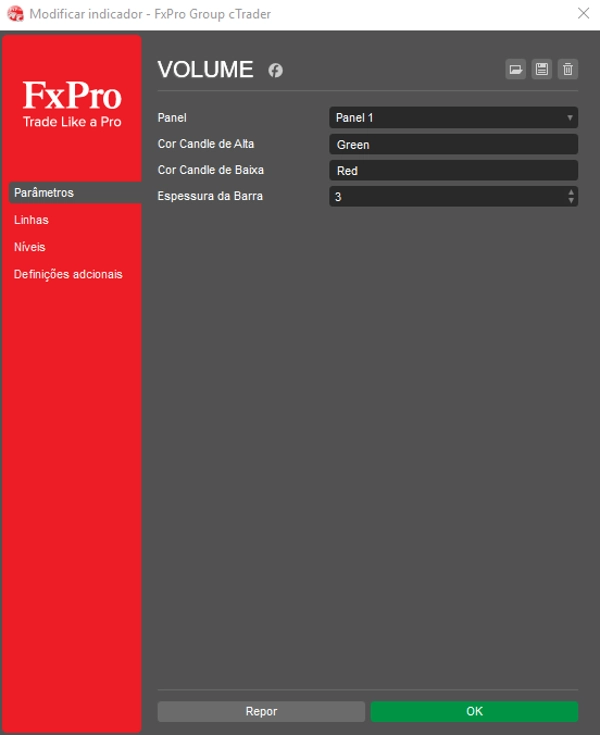
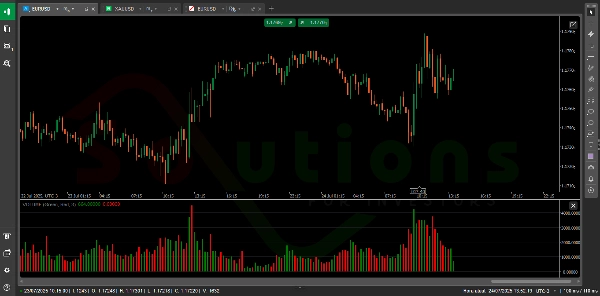
VolumeColorBar ist ein leistungsstarkes Werkzeug, das das Marktvolumen visuell mithilfe farbcodierter Balken basierend auf der Kerzenrichtung darstellt. Grüne Balken zeigen das Volumen bei bullischen Kerzen (Kaufdruck) an, während rote Balken das Volumen bei bärischen Kerzen (Verkaufsdruck) widerspiegeln. Dies ermöglicht es Händlern, sofort einzuschätzen, ob die Marktaktivität eher von Käufern oder Verkäufern getrieben wird — was hilft, Ausbrüche zu bestätigen, Umkehrungen zu erkennen und das Timing von Trades mit größerem Vertrauen zu verbessern.
Zusammenfassung
KI-Zusammenfassung
VolumeColorBar is a trading indicator that visualizes market volume using color-coded bars aligned with candle direction. It displays green bars for volume on bullish candles, indicating buying pressure, and red bars for volume on bearish candles, indicating selling pressure. This visual representation helps traders quickly assess whether market activity is dominated by buyers or sellers. The indicator supports various markets and symbols, including Forex pairs (EURUSD, GBPUSD, NZDUSD, USDJPY), cryptocurrencies (BTCUSD, crypto), commodities (XAUUSD, gold, oil, silver), indices (NAS100, SP500, DAX, Dow), and stocks. By providing immediate insight into volume dynamics relative to price movement, VolumeColorBar aids in confirming breakouts, identifying potential reversals, and improving trade timing decisions.
Indikatorprofil
Kundenbewertungen
4.3
Bewertungen: 3
5 | 33 % | |
4 | 67 % | |
3 | 0 % | |
2 | 0 % | |
1 | 0 % |
Kundenbewertungen
April 14, 2025
Clean tool for workflow for a more controlled workflow. It helps with planning entries around the first range, but false breaks still need filtering. I would track 20 market opens, the first 30 to 60 minutes and a target near 1.5R. I would still keep manual review in the process.
April 13, 2025
April 13, 2025
Worth a closer look around opening range breakouts. The useful part is planning entries around the first range, with the numbers checked before scaling. The setup should be tested across at least 15 sessions because 2 or 3 fakeouts can change the picture. The trade idea is clear, but it needs a hard stop and a defined breakout rule.
Diskussion
Häufig gestellte Fragen (FAQ)
BTCUSD
Forex
Signal
Breakout
Indices
EURUSD
Commodities
GBPUSD
NZDUSD
Prop
Crypto
Stocks
XAUUSD
NAS100
USDJPY
Über den cTrader Store verfügbare Produkte, einschließlich Handelsbots, Indikatoren und Plugins, werden von externen Entwicklern bereitgestellt und nur zu Informations- und technischen Zugriffszwecken verfügbar gemacht. cTrader Store ist kein Broker und erbringt keine Anlageberatung, persönlichen Empfehlungen oder eine Garantie für zukünftige Performance.


Preis
Seit 05/02/2025
31
Verkäufe