
KANDIKA HEAT MAP
Indikator
1 käufe
Version 1.0, Jul 2025
Windows, Mac
4.6
Bewertungen: 3
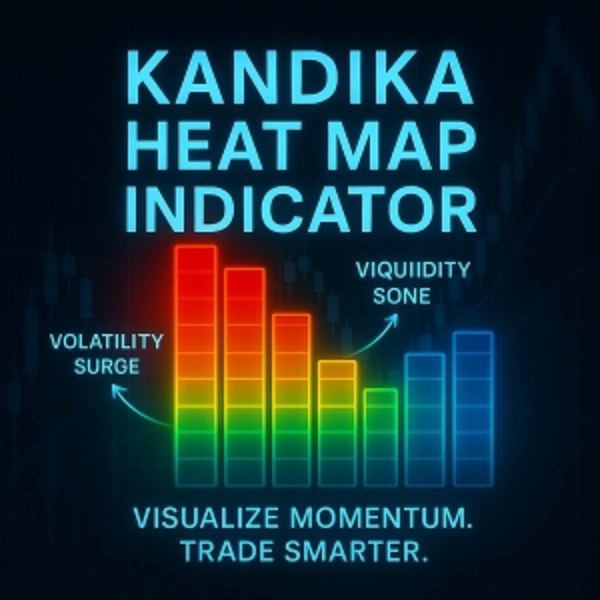
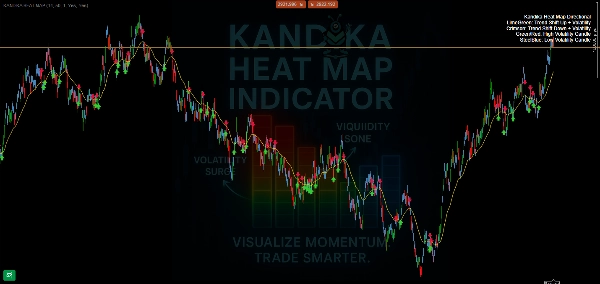
🎨 Color Logic – Was es Ihnen sagt
- 🟩 Limettengrün → Trendwende nach oben
Eine bullische Momentum-Änderung bildet sich. Nutzen Sie sie, um frühe Aufwärtsbewegungen zu erfassen. - 🟥 Karmesinrot → Trendwende nach unten
Signalisiert zunehmenden Abwärtsdruck. Bereitet Sie auf mögliche Short-Positionen oder Ausstiege vor. - 🟧/🔴 Orange/Rot → Zone hoher Volatilität
Erwarten Sie Preisspitzen, schnelle Bewegungen und mögliche Fallen. Kein Ort für blindes Raten – bestätigen Sie Ihre Strategie. - 🟦 Stahlblau → Zone niedriger Volatilität
Der Markt verlangsamt sich, komprimiert oder bewegt sich seitwärts. Oft bereitet dies Ausbruchsmöglichkeiten vor.
📊 Was es tut (und nicht tut)
- ✅ Zeigt klar Richtungsänderungen des Trends auf
- ✅ Unterscheidet visuell ruhige von volatilen Zonen
- ✅ Einfache, chartfreundliche Überlagerung – kein Durcheinander
Indikatorprofil
4.6
Bewertungen: 3
5 | 67 % | |
4 | 33 % | |
3 | 0 % | |
2 | 0 % | |
1 | 0 % |
Kundenbewertungen
August 4, 2025
No reason to yolo this live without a few normal sessions, and Bad settings can ruin the idea.
July 26, 2025
20 percent less clicking is the line to watch. Market checks feel quicker.
Über den cTrader Store verfügbare Produkte, einschließlich Handelsbots, Indikatoren und Plugins, werden von externen Entwicklern bereitgestellt und nur zu Informations- und technischen Zugriffszwecken verfügbar gemacht. cTrader Store ist kein Broker und erbringt keine Anlageberatung, persönlichen Empfehlungen oder eine Garantie für zukünftige Performance.


Seit 08/06/2025
1
Verkäufe