
Vision - Advanced Session Indicator
مؤشر
6 عمليات الشراء
الإصدار 1.0، Jul 2025
Windows, Mac
5.0
التقييمات: 2
الوصف
مؤشر الجلسة المتقدم
الوصف:
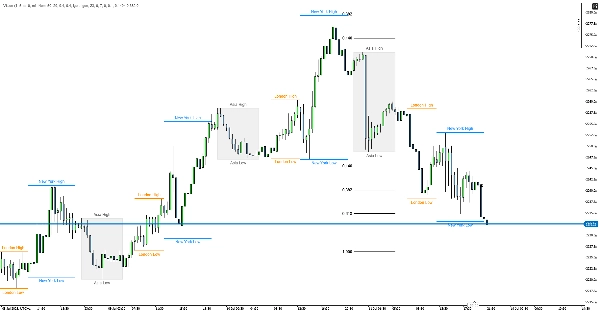
مؤشر جلسة احترافي لـ cTrader يعرض نطاقات الأسعار للجلسات التداولية الرئيسية ويضيف تحليل ملف الحجم لكل جلسة.
الميزات الرئيسية:
📊 صناديق وخطوط سعر الجلسة
- 4 جلسات تداول رئيسية: آسيا، فرانكفورت، لندن، نيويورك
- توقيت قابل للتخصيص بالكامل: يمكن تكوين كل جلسة بشكل منفصل
- صناديق وخطوط نطاق السعر ملونة: تعرض بصريًا قيم الأعلى/الأدنى لكل جلسة
- معالجة تلقائية للمنطقة الزمنية
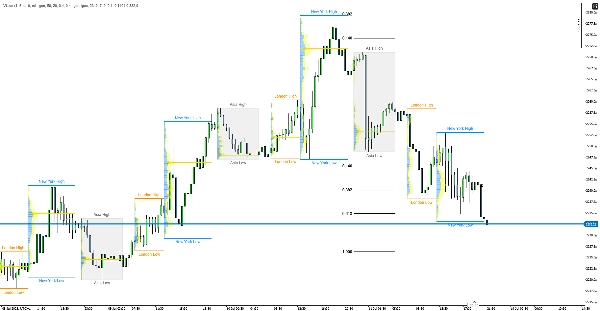
📈 ملف حجم الجلسة
- عرض توزيع الحجم: ملف حجم منفصل لكل جلسة
- حجم الشراء/البيع: ألوان منفصلة (أزرق/أصفر)
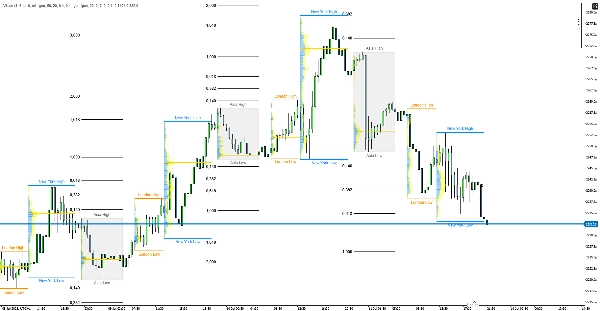
- POC (نقطة التحكم): تحديد مستوى السعر بأعلى حجم
- دقة قابلة للتخصيص: مخطط حجم من 10 إلى 500 مستوى
الإعدادات
أوقات الجلسات
- آسيا: 23:00-07:00 (رمادي)
- فرانكفورت: 07:00-08:00 (أخضر داكن)
- لندن: 09:00-14:00 (برتقالي)
- نيويورك: 14:00-22:00 (أزرق)
خيارات قابلة للتخصيص
- شفافية وألوان الصندوق والخط
- تغيير تمديد جلسة آسيا
- عرض وشفافية مخطط الحجم
- عدد الأيام للعرض
- عرض خط POC
- أطر زمنية منفصلة لصناديق الجلسة وملف الحجم
الاستخدام
تطبيق التداول:
- مستويات الأعلى/الأدنى للجلسة كنقاط دعم/مقاومة
- عناقيد الحجم لتحديد المستويات المهمة
- خطوط POC كمستويات مغناطيسية
- تداخلات الجلسات ذات الأهمية المميزة
المزايا: الجمع بين تحليل حركة السعر والحجم، تحديثات في الوقت الحقيقي، تخصيص كامل، مظهر احترافي.
الملخص
ملخص الذكاء الاصطناعي
Vision - Advanced Session Indicator is a professional tool designed for the cTrader platform to visualize and analyze major trading sessions: Asia, Frankfurt, London, and New York. It displays session price ranges using color-coded boxes and lines, highlighting high and low values for each session. The indicator supports full customization of session times, colors, transparency, and display settings, including separate timeframes for session boxes and volume profiles.
Key features include a session volume profile that shows volume distribution with distinct buy/sell volume colors and marks the Point of Control (POC), the price level with the highest traded volume. Users can customize the volume histogram resolution from 10 to 500 levels. The indicator automatically handles time zones and adjusts for Daylight Saving Time to ensure accurate session tracking.
Vision aids traders by marking session high/low levels as support and resistance points, identifying volume clusters and liquidity zones, and highlighting session overlaps. It is particularly useful for day traders seeking detailed insights into market behavior and potential entry levels based on volume and price action across different trading sessions.
ملف تعريف المؤشر
تقييمات العملاء
5.0
التقييمات: 2
5 | 100 % | |
4 | 0 % | |
3 | 0 % | |
2 | 0 % | |
1 | 0 % |
تقييمات العملاء
July 27, 2025
The entry needs one more reason to make sense, but the market context still matters.
July 15, 2025
The practical angle is weak trade ideas become less attractive, and signal count matters more than one nice example.
مناقشة
الأسئلة الشائعة
Prop
Forex
Indices
Crypto
يتم توفير المنتجات المتاحة من خلال cTrader Store، بما في ذلك روبوتات التداول والمؤشرات والإضافات، من قبل مطوري الطرف الثالث وإتاحتها لأغراض الوصول المعلوماتي والفني فقط. cTrader Store ليس وسيطًا ولا يقدم نصائح استثمارية أو توصيات شخصية أو أي ضمان للأداء المستقبلي.


السعر
منذ 05/01/2025
14
المبيعات