
الوصف
الملف المتقدم لحجم التداول: النطاق الثابت المؤسسي وتدفق الأوامر
قم بترقية تحليلك للسوق باستخدام الملف المتقدم لحجم التداول، مؤشر عالي التحسين من الدرجة المؤسسية مصمم للمتداولين. تم بناؤه لمتداولي اليوم، والمتداولين السريع، والمتداولين المتأرجحين الذين يعتمدون على نظرية سوق المزاد، هذه الأداة تجلب الدقة لتوزيع الحجم، ومناطق القيمة، وديناميكيات تدفق الأوامر.
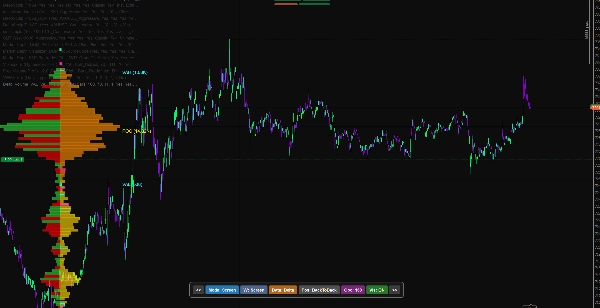
على عكس ملفات حجم التداول العادية التي يعيد حسابها باستمرار، أو تتحرك، أو تنكسر عند التكبير والتصغير، يقدم هذا المؤشر وضع المرساة الحقيقي (النطاق الثابت) مع الاحتفاظ بالذاكرة، مما يجعله الأداة المثالية للتداول الحي والتحليل التاريخي الدقيق.
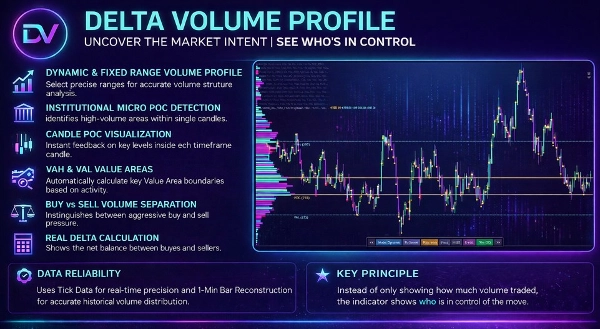
🔥 الميزات الأساسية وميزة التداول
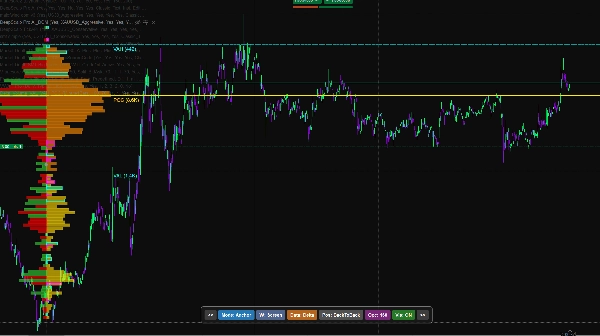
1. وضع المرساة الحقيقي (مثالي للتحليل التاريخي)
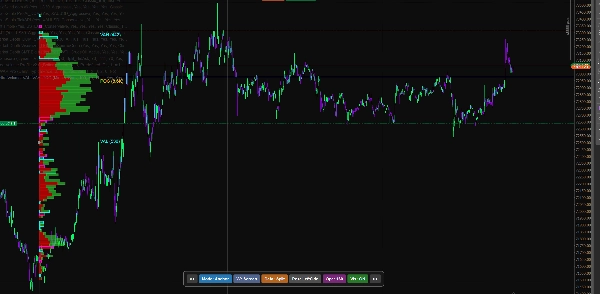
توقف عن المعاناة مع الملفات المتحركة! مع وضع المرساة، يمكنك وضع خطين عموديين تفاعليين في أي مكان على الرسم البياني لتحليل تأرجح معين، جلسة، أو منطقة تجميع.
- عدم التشويه: قم بالتكبير، التصغير، أو التمرير — يبقى الملف محكمًا رياضيًا عند نقاط المرساة التي اخترتها.
- التحليل التاريخي: قم بالتمرير إلى الوراء لأشهر أو سنوات، اربط الملف بحدث سوقي سابق، وحلل توزيع الحجم الدقيق ونقطة السيطرة (POC) كما حدثت. تتذكر المراسي مواقعها الدقيقة، مما يسمح لك بدراسة الإعدادات السابقة بدقة دون إعادة تعيين الشبكة.
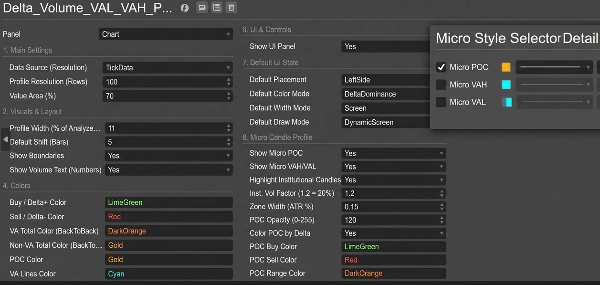
2. لوحة واجهة مستخدم تفاعلية على الرسم البياني
لا حاجة لفتح إعدادات المؤشر باستمرار. لوحة واجهة مستخدم أنيقة وغير متطفلة في أسفل الرسم البياني تتيح لك:
- التبديل بين وضع الشاشة (ديناميكي) ووضع المرساة (نطاق ثابت) بنقرة واحدة.
- تحريك موقع الملف (يسار، يمين، متتالي).
- تعديل العرض البصري والشفافية بسهولة.
- التبديل بين تقسيم الشراء/البيع وهيمنة الدلتا لتلوين الحجم.
3. رؤى عميقة لتدفق الأوامر
اقرأ البنية الدقيقة للسوق كمحترف:
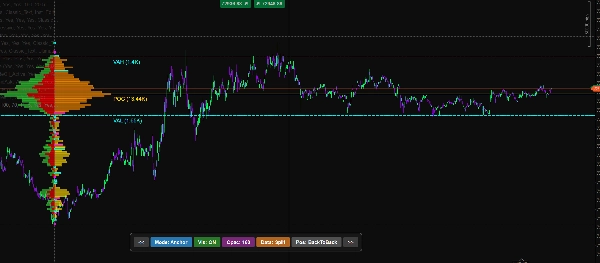
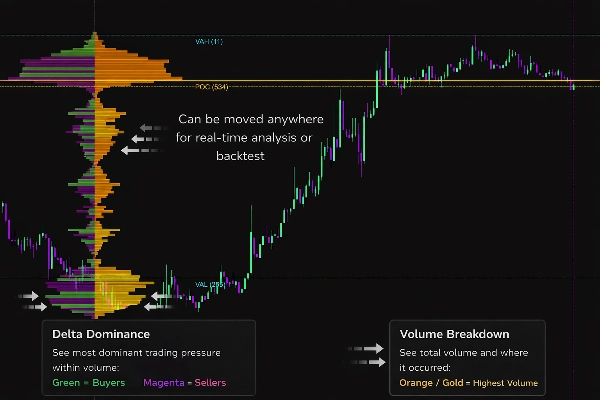
- هيمنة الدلتا والتقسيم: تصور الشراء العدواني مقابل البيع في كل عقد سعري.
- اختلالات الحجم: اكتشف وابرز تلقائيًا اختلالات الشراء/البيع الضخمة (نسبة قابلة للتخصيص، مثلاً 300% هيمنة) لرصد الامتصاص المؤسسي أو الاختراقات العدوانية.
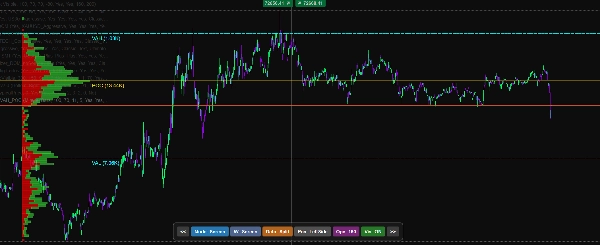
- كشف عقد الحجم العالي والمنخفض: يحدد بوضوح عقد الحجم العالي (مغناطيسات للسعر) وعقد الحجم المنخفض (فراغات السيولة حيث يتحرك السعر بسرعة).
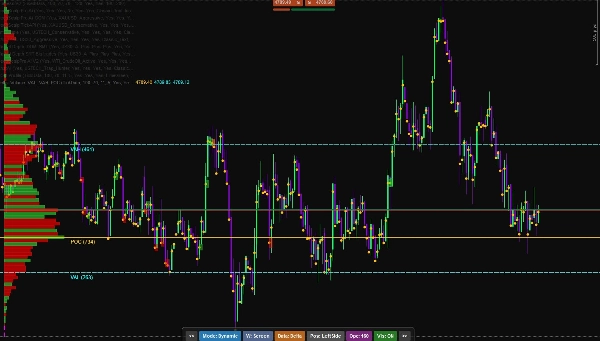
4. منطقة القيمة الديناميكية ونقطة السيطرة العارية
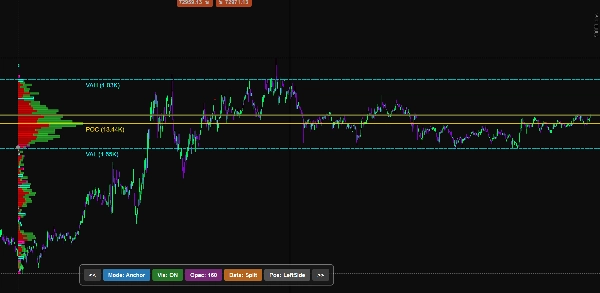
- يعرض بدقة قمة منطقة القيمة (VAH) وقاع منطقة القيمة (VAL) بناءً على الانحرافات المعيارية (الافتراضي 70%).
- يسلط الضوء على نقطة السيطرة (POC).
- تمديد نقطة السيطرة العارية: يمد خطوط POC غير المحددة تلقائيًا إلى المستقبل، مما يوفر لك أهداف دعم ومقاومة تفاعلية للغاية.
5. محسّن للغاية
- مصادر البيانات: اختر بين بيانات التيك فائقة الدقة أو بيانات الشمعة الواحدة الدقيقة الخفيفة لتحليل تاريخي طويل الأمد.
- العرض الذكي: مصمم للتعامل مع كميات هائلة من البيانات دون تجميد منصتك.
🛠️ كيفية استخدامه للتعلم عند عدم التداول:
- ارجع إلى التاريخ المطلوب على الرسم البياني.
- انقر على "الوضع: المرساة" في لوحة الواجهة.
- اسحب الخطين العموديين المنقطين لتغليف تأرجح السعر أو جلسة التداول التي تريد تحليلها بدقة.
- يتم إنشاء ملف الحجم على الفور. يمكنك التكبير إلى الرسم البياني لمدة دقيقة واحدة لفحص نقاط الدخول الدقيقة، الاختلالات، وإعادة اختبار منطقة القيمة دون فقدان الملف لموقعه!
تحكم في مخططاتك. توقف عن تداول أنماط التجزئة وابدأ تداول حجم المؤسسات.
الملخص
An interactive on-chart UI panel enables quick toggling between dynamic Screen Mode and fixed Anchor Mode, profile position adjustments, visual customization, and switching between Buy/Sell Split and Delta Dominance volume coloring. The tool offers deep order flow insights, including visualization of aggressive buying versus selling, automatic detection of volume imbalances, and identification of High Volume Nodes (HVN) and Low Volume Nodes (LVN).
It displays dynamic Value Area High (VAH), Value Area Low (VAL), and Point of Control (POC) lines, with an option to extend naked POC lines as future support/resistance targets. Users can select data sources between tick data and 1-minute bars for optimized performance and historical analysis. The indicator is engineered for efficient rendering to handle large datasets without platform lag.
تقييمات العملاء
5 | 50 % | |
4 | 50 % | |
3 | 0 % | |
2 | 0 % | |
1 | 0 % |


