
Descripción
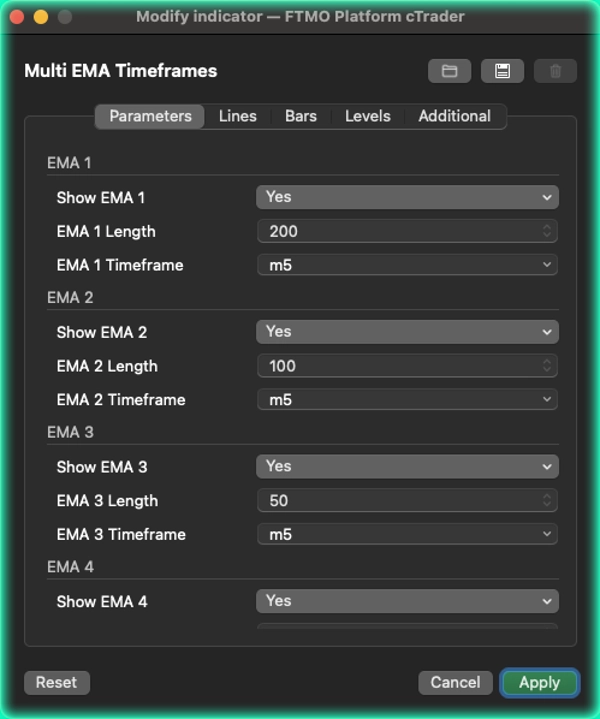
Multi EMA Timeframes by [BeyondTrading] El error más común que cometen los traders con las medias móviles es cambiar de marcos temporales solo para verificar dónde se encuentra una EMA clave. Multi EMA Timeframes elimina eso por completo. Permaneces en tu marco temporal de trabajo — tu gráfico de 5 minutos, tu gráfico de 15 minutos, tu gráfico de 1 hora — y defines exactamente qué EMA de qué marco temporal debe aparecer en tu gráfico, ahora mismo, sin moverte de lugar.
Estás en el gráfico de 5 minutos y quieres ver la EMA 200 del horario? Hecho. ¿También quieres la EMA 50 del gráfico de 15 minutos y la EMA 20 del marco temporal actual lado a lado? También hecho. Cada una de las cinco EMAs se configura completamente de forma independiente: su propio período, su propio marco temporal fuente, su propio color y su propio interruptor de encendido/apagado.
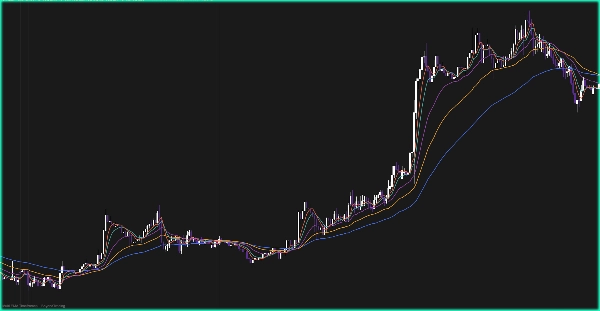
Esto es particularmente poderoso para configuraciones de confluencia. Cuando el precio en tu marco temporal de entrada se acerca a una EMA que pertenece a un marco temporal mucho mayor, ese nivel tiene un peso estructural real. Verlo directamente en tu gráfico — sin cambiar de pestaña, sin dudar del valor exacto — cambia la forma en que interactúas con esas zonas clave.
Dos modos de renderizado te permiten controlar cómo se dibujan las líneas. El modo paso congela cada EMA en la última barra fuente completamente cerrada, por lo que el valor nunca cambia hasta que la barra del marco temporal superior se cierre — sin repintado, totalmente confiable para decisiones de trading en vivo. El modo suave interpola continuamente entre barras fuente para una visualización más limpia, mejor para análisis y revisión.
Qué lo hace diferente La mayoría de los indicadores multi-EMA calculan todo en el marco temporal actual del gráfico. Aquí, cada EMA se obtiene genuinamente de su propio marco temporal independiente. No estás aproximando — estás leyendo la EMA real que los traders en ese marco temporal realmente ven.
Características
- Hasta 5 EMAs completamente independientes, cada una con su propio marco temporal y período
- Permanece en cualquier marco temporal del gráfico mientras lees EMAs de cualquier otro marco temporal
- Modo paso: valores bloqueados a barras fuente cerradas, sin repintado
- Modo suave: interpolación lineal para transiciones visuales fluidas
- Interruptor de mostrar/ocultar por EMA para mantener tu gráfico limpio en todo momento
Resumen
Valoraciones de clientes
5 | 50 % | |
4 | 50 % | |
3 | 0 % | |
2 | 0 % | |
1 | 0 % |


