
설명
제로 래그 LSMA(최소제곱 이동평균)는 트렌드 분석에서 향상된 반응성과 정밀도를 추구하는 트레이더를 위해 설계된 최첨단 기술 지표입니다. 가격 움직임에 뒤처지는 전통적인 이동평균과 달리, 이 지표는 이중 선형 회귀 과정을 적용하여 지연을 최소화하며, 실시간으로 트렌드 방향과 잠재적 반전을 식별하는 데 이상적입니다. 이 지표는 외환, 주식, 원자재 및 기타 시장에 적합합니다.
주요 특징
- 제로 래그 성능: 전통적인 이동평균에 내재된 지연을 줄여 트렌드 변화에 대한 신속한 신호를 제공합니다.
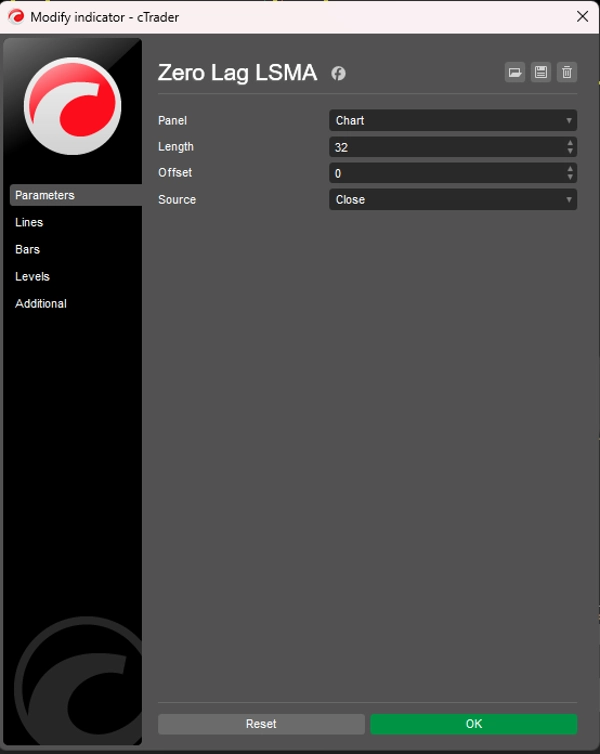
- 맞춤형 매개변수: 거래 전략에 맞게 길이, 오프셋 및 가격 소스(시가, 고가, 저가, 종가)를 조정할 수 있습니다.
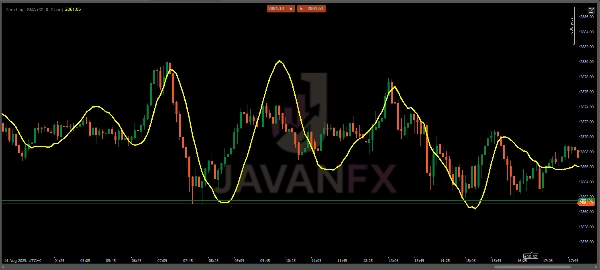
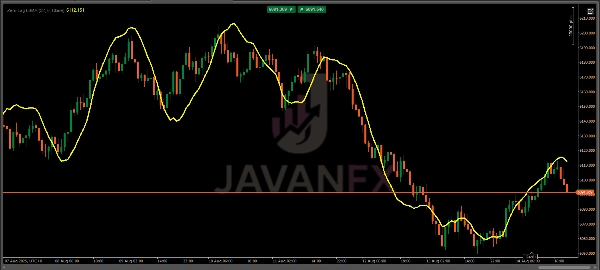
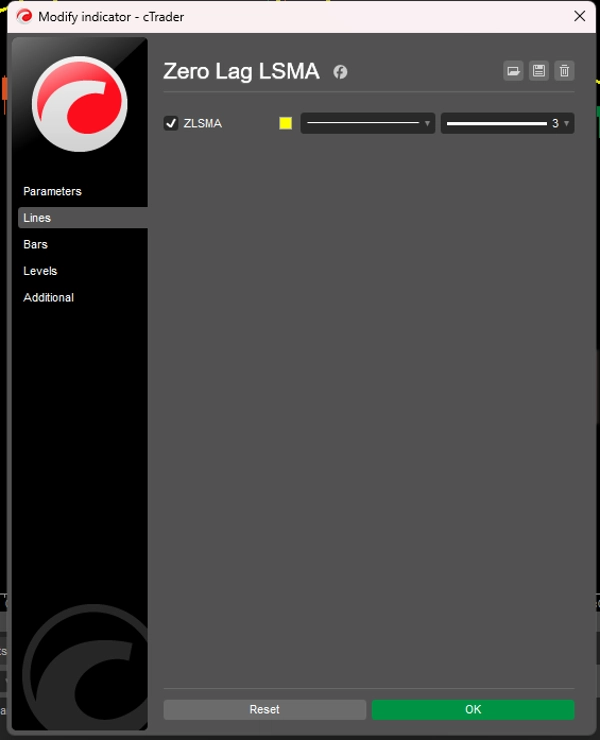
- 시각적으로 직관적: 가격 차트 위에 부드러운 노란색 선으로 표시되어 쉽게 해석할 수 있습니다.
- 다양한 적용: 스캘핑, 데이 트레이딩, 스윙 트레이딩 및 다양한 시간대의 장기 전략에 적합합니다.
사용 방법
- 트렌드 식별:
-
- ZLSMA 선이 상승 기울기를 보일 때, 이는 강세 추세를 나타냅니다.
- 하락 기울기는 약세 추세를 시사합니다.
- 평평하거나 불규칙한 움직임은 횡보 또는 추세 부재를 나타낼 수 있습니다.
- 진입/청산 신호:
-
- 매수 신호: 가격이 ZLSMA 선을 상향 돌파할 때, 특히 확인된 상승 추세 후에 롱 포지션에 진입합니다.
- 매도 신호: 가격이 하락 추세 중에 ZLSMA 선을 하향 돌파할 때 숏 포지션에 진입합니다.
- 청산 신호: 가격이 다시 ZLSMA를 교차하거나 선이 평평해져 잠재적 추세 반전을 나타낼 때 청산을 고려합니다.
- 확인:
-
- ZLSMA를 다른 지표(예: RSI, MACD) 또는 지지/저항 수준과 결합하여 신호를 확인하고 잘못된 돌파를 피합니다.
- 더 강한 추세 신호를 위해 상위 시간대(H1, H4, D1)에서 사용하거나 스캘핑을 위해 하위 시간대(M5, M15)에서 사용합니다.
거래 전략
- 추세 추종: ZLSMA를 사용하여 강한 추세를 타고, 추세 방향으로 ZLSMA 선으로의 되돌림 시 진입합니다.
- 반전 거래: ZLSMA 선과 가격의 다이버전스 및 캔들스틱 패턴(예: 핀 바, 엔골핑 캔들)을 결합하여 반전 설정을 찾습니다.
- 돌파 거래: 높은 변동성 기간 동안 ZLSMA 위/아래 가격 돌파를 모니터링하여 잠재적 진입점을 찾습니다.
최적 사용을 위한 팁
- 시장 상황에 맞게 길이 조정: 빠른 시장이나 스캘핑에는 짧은 길이(예: 10-20)를 사용하고, 상위 시간대에서 부드러운 추세를 위해 긴 길이(예: 50-100)를 사용합니다.
- 데모 계정에서 테스트: 실거래 전에 데모 계정에서 ZLSMA를 백테스트하여 선호하는 시장에서의 동작을 이해합니다.
- 횡보장에서는 과도한 거래 피하기: ZLSMA는 추세 시장에서 가장 잘 작동하므로, 횡보장에서의 채찍질을 피하기 위해 추가 필터(예: ADX)를 사용합니다.
요약
AI 요약
The Zero Lag LSMA (Least Squares Moving Average) is a technical indicator designed to enhance trend analysis by minimizing the lag typical of traditional moving averages. It uses a double linear regression process to provide faster and more responsive signals, making it suitable for real-time identification of trend direction and potential reversals. The indicator is applicable across various markets including forex, stocks, and commodities.
Key features include customizable parameters such as length, offset, and price source (Open, High, Low, Close), allowing adaptation to different trading strategies. It displays as a smooth yellow line overlaid on the price chart for clear visual interpretation. The indicator supports multiple trading styles and timeframes, from scalping to long-term strategies.
Traders use the Zero Lag LSMA to identify trends by observing the slope of the line: upward for bullish trends, downward for bearish, and flat for consolidation. Entry and exit signals are generated when price crosses the LSMA line, with additional confirmation recommended through other indicators or support/resistance levels. The indicator supports trend following, reversal, and breakout trading strategies, with adjustable settings to optimize performance under varying market conditions.
지표 프로필
고객 리뷰
4.6
리뷰: 3
5 | 67 % | |
4 | 33 % | |
3 | 0 % | |
2 | 0 % | |
1 | 0 % |
고객 리뷰
October 10, 2025
Zero lag, full clarity ⚡ LSMA tracks price action like a scalpel — sharp, fast, and smooth. Great trend filter for any timeframe!
August 27, 2025
The only reason it stays interesting is the setup needs less second guessing. A normal demo run is enough to see the weak spots.
August 16, 2025
Not bad if the rules are already clear. Spread and slippage need a line in the notes.
상담
자주 묻는 질문(FAQ)
트레이딩 봇, 지표, 플러그인 등 cTrader Store에서 제공되는 상품은 제3자 개발자에 의해 제공되며, 이는 단순히 정보 및 기술적 접근을 목적으로 제공된 것입니다. cTrader Store는 중개인이 아니며, 투자 조언, 개인별 추천 또는 향후 성과에 대한 어떠한 보장도 제공하지 않습니다.


가격
가입일 14/07/2025
60
판매