
Descrizione
Mappa di Correlazione – Il Tuo Strumento Essenziale per le Intuizioni di Mercato
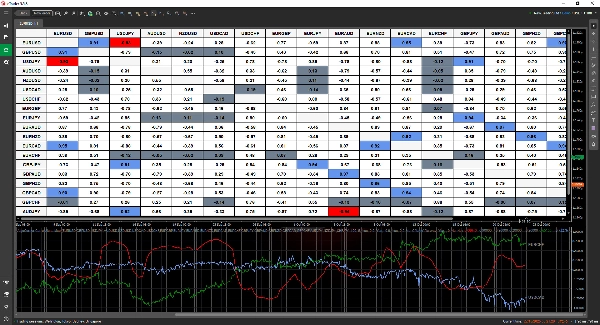
La Mappa di Correlazione è un indicatore potente ma intuitivo progettato per aiutarti a scoprire le relazioni tra gli asset a colpo d'occhio. Con il suo formato tabellare facile da leggere, puoi individuare rapidamente le correlazioni e prendere decisioni di trading più informate.
✅ Personalizza la Tua Analisi – Seleziona e confronta quante coppie di trading la tua piattaforma consente.
✅ Intervalli Temporali Flessibili – Analizza le correlazioni su qualsiasi intervallo temporale per adattarti alla tua strategia.
✅ Visualizzazione Chiara e Adattabile – Scegli tra formato decimale (-1 a 1) o percentuale (-100% a 100%).
✅ Evidenziazione Intelligente – Identifica facilmente correlazioni forti e deboli con codifica colore personalizzabile.
✅ Avvisi in Tempo Reale – Rimani aggiornato con notifiche quando i valori di correlazione cambiano significativamente.
✅ Dati Interattivi – Clicca su qualsiasi cella per monitorare come evolvono le correlazioni nel tempo.
✅ Miglioramenti Continui – Goditi aggiornamenti futuri senza costi aggiuntivi.
Scopri le relazioni chiave del mercato e affina la tua strategia di trading con la Mappa di Correlazione! 🚀
Riepilogo
Key features include customizable display options with correlation values shown in decimal (-1 to 1) or percentage (-100% to 100%) formats, and smart color-coded highlighting to quickly identify strong or weak correlations. Users can interact with the data by clicking on any cell to track how correlations evolve over time. Real-time alerts notify users of significant changes in correlation values, aiding timely decision-making.
This tool is intended to help traders uncover relationships between assets efficiently, supporting more informed market analysis and strategy refinement.
Recensioni dei clienti
5 | 67 % | |
4 | 33 % | |
3 | 0 % | |
2 | 0 % | |
1 | 0 % |


![Logo di "Gaussian Channel [Iridio Capital]"](https://cdn.ctrader.com/image/webp/7c039209-5573-4a54-a072-f9528b503103_41960)


