
설명
[BeyondTrading]의 ATR 비율 슈퍼트렌드
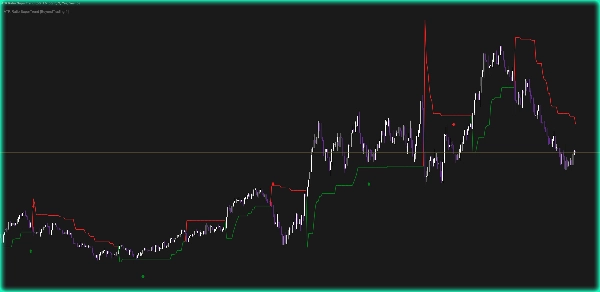
ATR 비율 슈퍼트렌드는 두 가지 보완 도구를 하나의 의사결정 중심 신호로 결합합니다. 한편으로 슈퍼트렌드는 시장 방향을 명확히 정의합니다 — 강세 조건일 때는 녹색, 약세 조건일 때는 빨간색입니다. 다른 한편으로 ATR 비율은 최근 변동성 범위 내에서 가격이 어디에 위치하는지 평가하여 약하거나 불확실한 움직임을 걸러내는 필터 역할을 합니다.
결과는 간단합니다: 방향과 실제 모멘텀이 모두 있을 때만 신호가 발생합니다.
이 두 조건이 일치할 때 — 확인된 추세와 의미 있는 변동성 임계값을 넘는 돌파 — 지표는 진입 화살표를 표시합니다. 재도색 없음, 지연 잡음 없음. 단지 구조에 기반한 명확하고 실행 가능한 신호입니다.
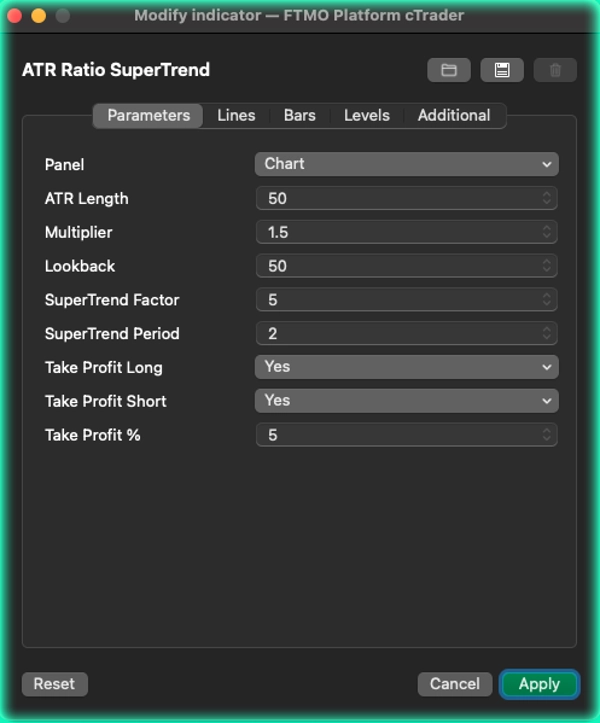
이익 실현 관리는 직접 통합되어 있습니다. 목표 비율을 정의하면 가격이 해당 수준에 도달할 때 지표가 자동으로 출구를 추적하고 표시합니다. 롱 및 숏 포지션은 독립적으로 설정할 수 있어 위험 대비 보상 논리를 완전히 제어할 수 있습니다.
차별점
대부분의 슈퍼트렌드 지표는 상황에 관계없이 모든 교차점에서 신호를 생성합니다. 이는 과도한 거래와 낮은 품질의 진입으로 이어집니다. 여기서 ATR 비율은 엄격한 필터 역할을 하여 가격이 단순히 횡보하는 것이 아니라 변동성 범위를 적극적으로 돌파할 때만 신호가 발생합니다.
신호는 적지만 확신은 훨씬 높습니다.
특징
- 실시간 색상 변경이 가능한 슈퍼트렌드 라인 (녹색 상승 추세, 빨간색 하락 추세)
- 검증된 고모멘텀 돌파 시에만 진입 화살표 표시
- 자동 시각 표시가 포함된 내장 이익 실현 감지 기능
- 완전한 사용자 정의 가능: ATR 길이, 배수, 조회 기간, 비율 인자, TP 비율
요약
지표 프로필
고객 리뷰
4.3
리뷰: 3
5 | 33 % | |
4 | 67 % | |
3 | 0 % | |
2 | 0 % | |
1 | 0 % |
고객 리뷰
April 15, 2026
The setup needs less second guessing, but sideways markets can fake the filter.
April 13, 2026
It works as a side layer because poor entries are easier to skip. Demo first makes more sense.
April 7, 2026
Not bad if the rules are already clear. Sideways markets can fake the filter.
상담
자주 묻는 질문(FAQ)
Prop
Forex
Signal
Indices
Commodities
Crypto
Stocks
트레이딩 봇, 지표, 플러그인 등 cTrader Store에서 제공되는 상품은 제3자 개발자에 의해 제공되며, 이는 단순히 정보 및 기술적 접근을 목적으로 제공된 것입니다. cTrader Store는 중개인이 아니며, 투자 조언, 개인별 추천 또는 향후 성과에 대한 어떠한 보장도 제공하지 않습니다.
이 작성자의 상품 더 보기


가격
가입일 21/01/2026
3
판매
180
무료 설치