
Dynamic Trend Gradient
지표
1 구매
버전 1.0, Jan 2025
Windows, Mac
4.0
리뷰: 2
설명
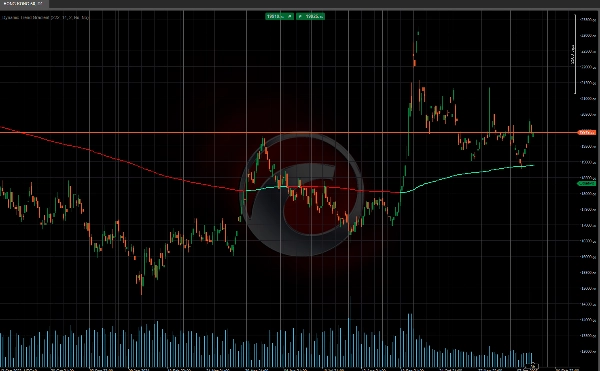
📈 이 지표는 가격 차트에서 추세 방향을 식별하고 시각화하는 데 도움이 되는 도구입니다. 📊 작동 원리는 지수 이동 평균과 변동성 측정을 사용하여 가격이 움직일 것으로 예상되는 구역을 결정하는 추세 수준을 계산하는 데 기반합니다. 아래에서 작동 방식을 자세히 설명하겠습니다:
📐 추세 수준 계산
이 지표는 "기준 수준"이라고 하는 것을 계산하는 것으로 시작합니다. 이 수준은 두 개의 지수 이동 평균을 평균내어 얻습니다: 하나는 단기(사용자가 정의한 길이, 이 경우 222)이고 다른 하나는 첫 번째의 두 배 길이인 장기입니다. 이 평균은 전체 추세에 대한 기준을 제공합니다.
다음으로, 종가의 표준 편차를 사용하여 변동성을 계산하고, 이 값을 추가 지수 이동 평균으로 평활화합니다. 평활화된 변동성은 "민감도"라는 매개변수와 곱해져 기준 수준 주변의 상하 수준을 제공합니다. 이 수준들은 추세 밴드 역할을 하며 가격이 추세 위에 있는지 아래에 있는지를 식별하는 데 도움을 줍니다.
📉📈 추세 상태
이 수준들이 계산되면, 지표는 시장의 추세 상태를 평가합니다. 가격이 기준 수준 위에 있으면 강세 추세 🐂로 간주하며, 아래에 있으면 추세는 약세 🐻로 간주합니다. 가격이 상단 또는 하단 수준을 넘으면, 지표는 추세 신호를 변경하여 가능한 반전이나 시장 모멘텀의 변화를 나타냅니다.
이 도구는 시장 추세를 앞서가고자 하는 트레이더에게 완벽한 도구입니다! 🚀📉📈
Ctrader 스토어 지표:
요약
지표 프로필
고객 리뷰
4.0
리뷰: 2
5 | 0 % | |
4 | 100 % | |
3 | 0 % | |
2 | 0 % | |
1 | 0 % |
고객 리뷰
January 27, 2025
It works as a side layer because there is less room for random clicking, and it is not the entire strategy.
January 24, 2025
상담
자주 묻는 질문(FAQ)
Signal
Breakout
Supertrend
RSI
트레이딩 봇, 지표, 플러그인 등 cTrader Store에서 제공되는 상품은 제3자 개발자에 의해 제공되며, 이는 단순히 정보 및 기술적 접근을 목적으로 제공된 것입니다. cTrader Store는 중개인이 아니며, 투자 조언, 개인별 추천 또는 향후 성과에 대한 어떠한 보장도 제공하지 않습니다.


가격
가입일 03/10/2024
163
판매
38.56K
무료 설치