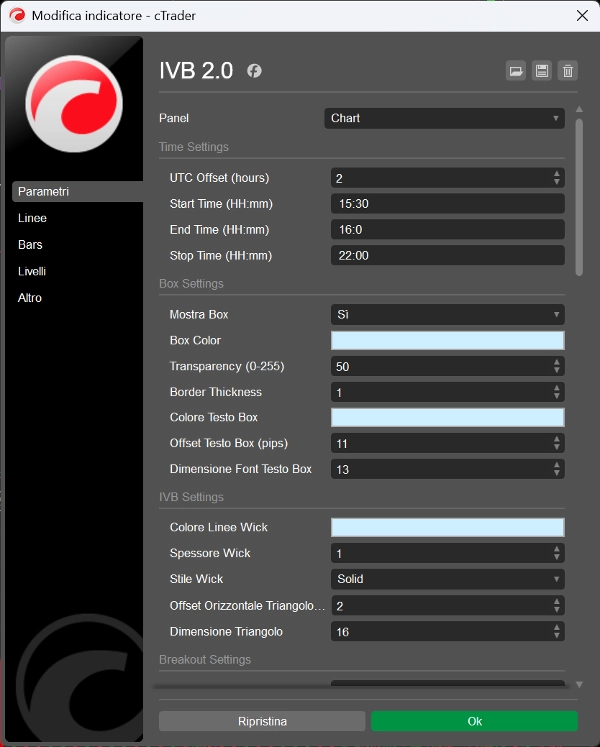
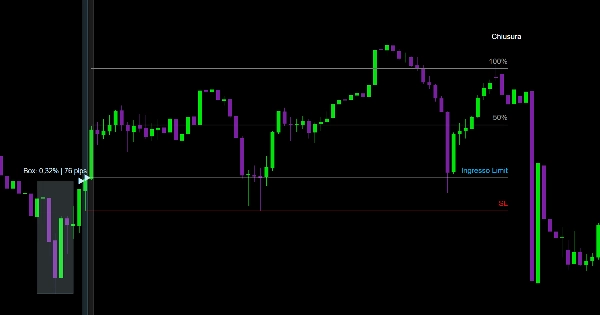
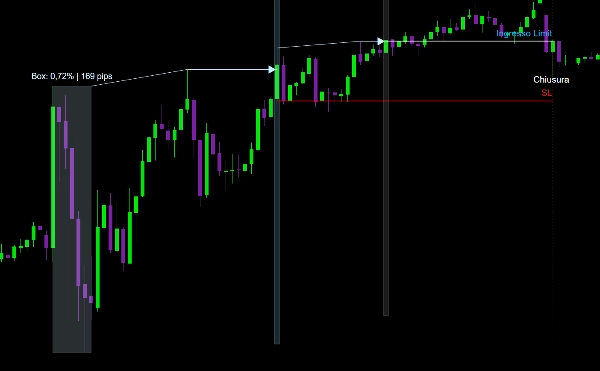
IVB 2.0
"IVB 2.0" 로고
30/08/2025
Desktop
가입일 20/08/2025
"IVB 2.0" 업로드된 이미지"IVB 2.0" 업로드된 이미지"IVB 2.0" 업로드된 이미지

Once the time range for creating the volatility box is defined, the indicator indicate breakouts, provides for entry points (Limit or Market), Stop Loss placement, and Take Profit levels at 50%/100%/200% projections once this box becomes imbalanced, is fully customizable: you can enable or disable each feature and adjust the colors to your preference.

This indicator is thinked for 5min timeframe.


0.0
리뷰: 0
고객 리뷰
이 상품에 대한 리뷰가 아직 없습니다. 이미 사용해 보셨나요? 다른 사람들에게 가장 먼저 소개해 주세요!
좋아하실 만한 다른 항목
지표
Signal
MACD
TradingViewMACD
Enhance your trading strategy with our customizable TradingViewMACD indicator. Optimize and elevate your market analysis
지표
Signal
TendSignal_indicator
Trend following signal
지표
NAS100
NZDUSD
Martingale
+26
Volume Delta
Read aggressive flow in real time. Flexible resets (Day/Week/Month), optional EMA smoothing, and non-repainting cumulati
지표
Forex
Signal
USDJPY
Yen Strength - Line Momentum
Single-line JPY Strength Indicator: Track yen momentum swiftly across key pairs—achieve clarity in your forex trades!
지표
Stocks
Forex
Signal
+1
Engulfing Pattern Indicator
Auto Fibonacci Retracement
Auto Fibonacci Retracement Indicator for cTrader
지표
Breakout
ATR
Supertrend
+3
Support Resistance Indicator
A custom support resistance indicator, specifically designed for scalping techniques.
지표
RSI
XAUUSD
Breakout
+4
SmartTrend Support & Resistance Lines
🚀 Auto-detects support/resistance & trend channels! Saves time ⏳, spots key levels 🔍
지표
XAUUSD
Forex
EURUSD
+2
ALMA Smoothed Gaussian Moving Average
ALMA Smoothed Gaussian Moving Average (ASGMA) – by LudwigICT
Bollinger Bands Breakout Oscillator (+ Alerts)
BB Breakout Oscillator with alerts! Spot trend reversals using Bollinger Bands. Bullish/Bearish crossovers Alerts.
TrendStrengthSignals
Edge-aware clouds + Pro HUD: better entries, calmer exits, adaptive risk.
지표
RSI
Indices
Signal
+2
[Stellar Strategies] Ultimate Trend & Momentum Dashboard
A comprehensive cTrader indicator designed to give you a quick, at-a-glance understanding of market sentiment 📈📉
지표
NAS100
NZDUSD
XAUUSD
+12
FVG_Bruno
Fair Value Gap
지표
Breakout
Fx4U.Multi TimeFrame Support & Resistance
Allow trader to visualize Support & Resistance across different timeframes,give trader an overview of the current market
지표
Indices
Breakout
Supertrend
[CB] Pivot Points Pro
You can use the cTrader Pivot Points Pro indicator to find a good pullback entry in a trend
지표
NAS100
Indices
RSI
+9
LIQUIDITY POOLS SIGNAL FREE
INDICATOR,LIQUIDITY POOLS,ACCURATE SIGNAL, NO DELAY,80% PROBABILITY
KANDIKA HEAT MAP
Color-Based Market Pressure & Volatility Visualizer The Kandika Heatmap Indicator