
설명
향상된 이동 평균 지표를 소개합니다. 이 지표는 거래 분석에서 더 나은 맞춤화와 유연성을 위해 설계되었습니다.
이 향상된 버전은 또한 틱 타임프레임과 헤이킨 아시에 대해 더 높은 시간 프레임 이동 평균을 지원합니다. 렌코 및 범위 기간은 아직 지원되지 않습니다.
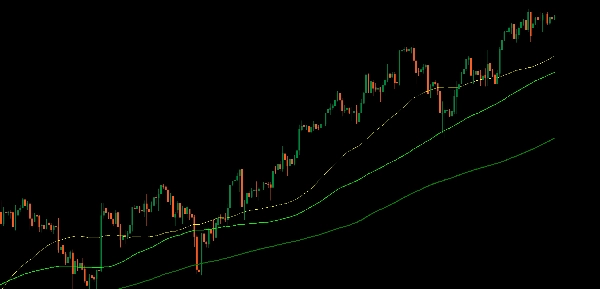
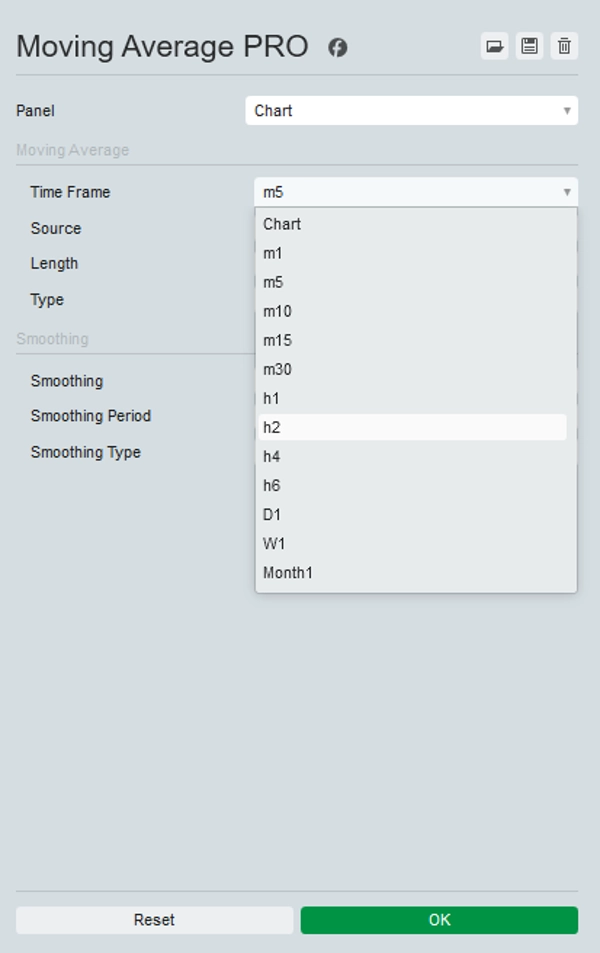
이 지표는 원하는 모든 시간 프레임을 선택할 수 있어, 예를 들어 일간 200 이동 평균을 다른 어떤 시간 프레임에도 표시할 수 있습니다.
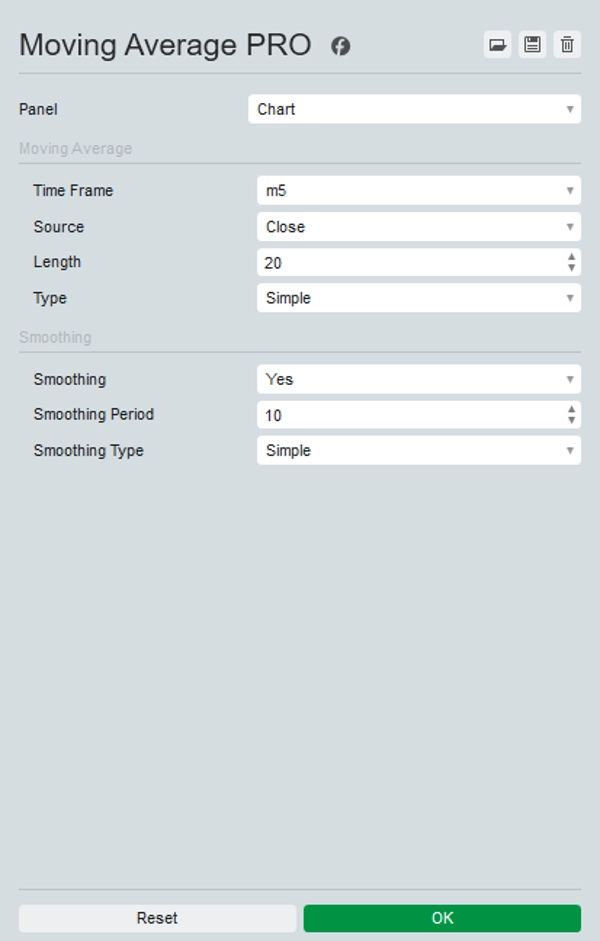
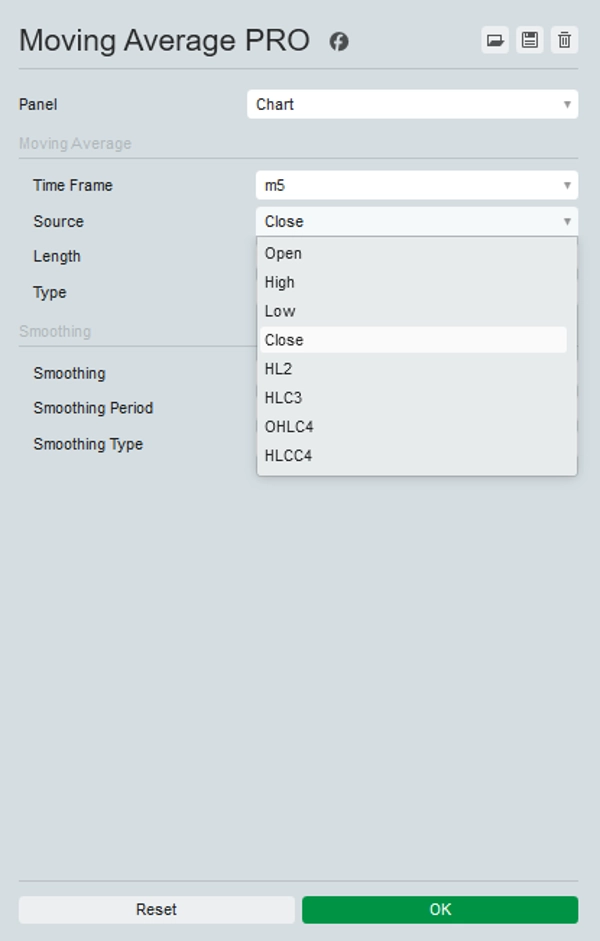
또한, 시가, 고가, 저가, 종가, HL2, HLC3, OHLC4, 그리고 HLCC4 등 TradingView와 동일한 다양한 가격 소스를 선택할 수 있으며, 낮은 시간 프레임에서 샘플링 문제를 해결하기 위한 선택적 평활화 옵션도 제공합니다.
이러한 옵션을 제공함으로써 이동 평균을 특정 거래 전략에 맞게 조정하고 시장 동향에 대해 더 정확한 통찰을 얻을 수 있습니다.
향상된 이동 평균 지표로 거래 도구를 업그레이드하여 우수한 분석과 의사 결정을 경험하세요.
요약
지표 프로필
고객 리뷰
5.0
리뷰: 1
5 | 100 % | |
4 | 0 % | |
3 | 0 % | |
2 | 0 % | |
1 | 0 % |
상담
자주 묻는 질문(FAQ)
BTCUSD
Forex
Indices
EURUSD
Commodities
GBPUSD
NZDUSD
Prop
Crypto
Stocks
XAUUSD
NAS100
USDJPY
트레이딩 봇, 지표, 플러그인 등 cTrader Store에서 제공되는 상품은 제3자 개발자에 의해 제공되며, 이는 단순히 정보 및 기술적 접근을 목적으로 제공된 것입니다. cTrader Store는 중개인이 아니며, 투자 조언, 개인별 추천 또는 향후 성과에 대한 어떠한 보장도 제공하지 않습니다.


좋아하실 만한 다른 항목


가격
가입일 25/09/2025
25
판매
315
무료 설치