
설명
궁극의 캔들스틱 모음은 오늘날 존재하는 대부분의 캔들스틱 패턴을 감지하는 데 도움을 주기 위해 마련되었습니다.
기술적 거래 도구인 캔들스틱 패턴은 가격 방향을 예측하기 위해 수세기 동안 사용되어 왔습니다. 가격 방향과 모멘텀을 결정하는 데 사용되는 다양한 캔들스틱 패턴에는 쓰리 라인 스트라이크, 투 레드 갭핑, 쓰리 레드 크로우, 이브닝 스타, 어밴던드 베이비 등이 포함됩니다.
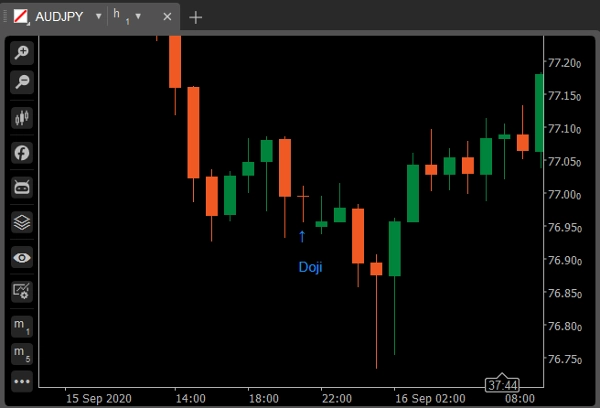
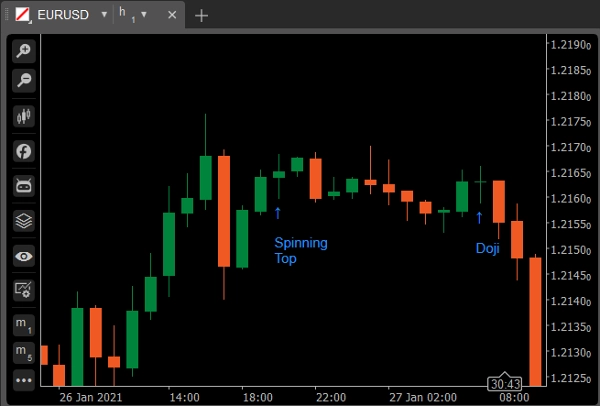
도지
도지 캔들스틱은 특정 기간 동안 증권의 시가와 종가가 거의 같을 때 형성되며, 일반적으로 기술 분석가들에게 반전 패턴을 신호합니다. 몸통 임계값은 전체 길이의 최대 5%입니다.
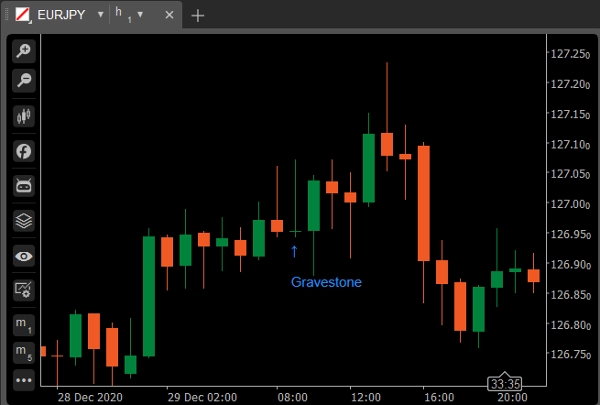
변형: 그레이브스톤 도지
자산의 고가, 시가, 종가가 (거의) 동일할 때 형성됩니다. 긴 하단 그림자는 캔들 기간 동안 공격적인 매도가 있었음을 시사하지만, 가격이 시가 근처에서 마감되었기 때문에 매수자가 매도를 흡수하고 가격을 다시 올렸음을 보여줍니다.
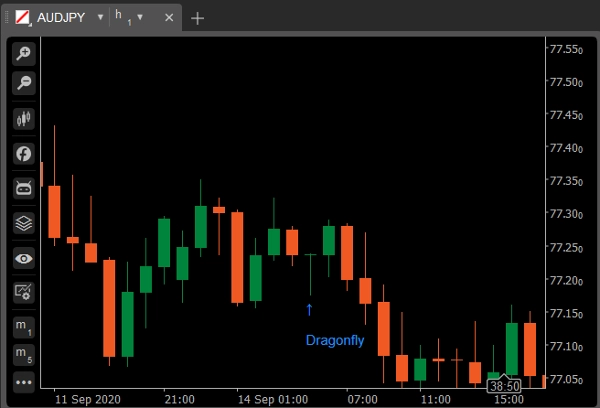
변형: 드래곤플라이 도지
그레이브스톤 도지는 저가, 시가, 종가가 (거의) 동일하고 캔들에 긴 상단 그림자가 있을 때 발생합니다. 그레이브스톤은 거꾸로 된 "T" 모양처럼 보입니다. 그레이브스톤과 드래곤플라이의 의미는 동일하며, 둘 다 가능한 추세 반전을 나타내지만 뒤따르는 캔들로 확인되어야 합니다.
스피닝 탑
스피닝 탑은 짧은 실제 몸통을 가진 캔들스틱 패턴으로, 긴 상단 및 하단 그림자 사이에 수직으로 중심을 둡니다. 이 캔들스틱 패턴은 자산의 미래 방향에 대한 우유부단함을 나타냅니다. 매수자와 매도자 모두 우위를 점하지 못했습니다. 몸통 임계값은 전체 길이의 최대 20%입니다.
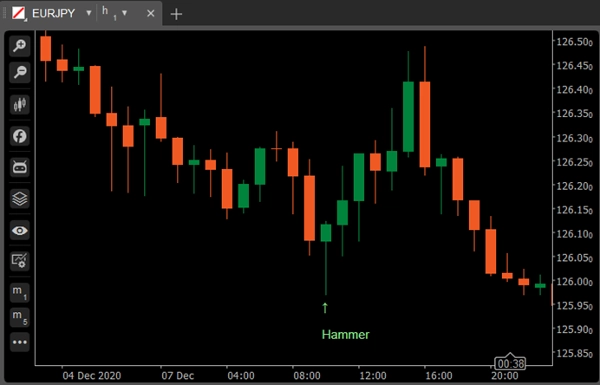
해머
해머는 상단 근처에 작은 몸통이 있고 상단 그림자가 거의 없거나 없는 녹색 또는 빨간색 캔들스틱이며 긴 하단 꼬리를 가집니다. 하락 추세 중에 강세 패턴으로 간주됩니다.
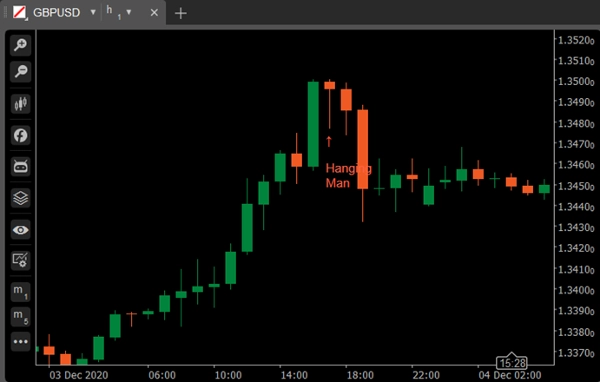
변형: 행잉 맨
상단 근처에 작은 몸통이 있고 상단 그림자가 거의 없거나 없는 녹색 또는 빨간색 캔들스틱이며 긴 하단 꼬리를 가집니다. 상승 추세 중에 약세 패턴으로 간주됩니다.
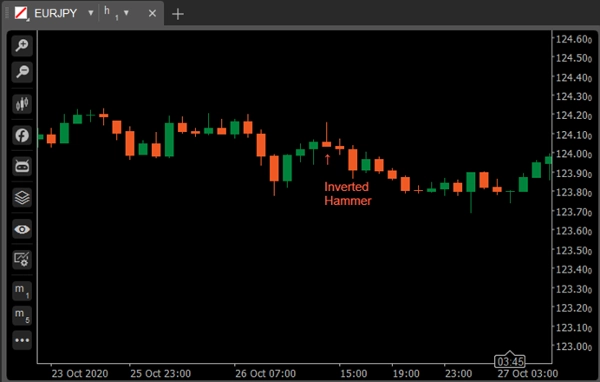
인버티드 해머
인버티드 해머는 하락 추세 후에 발견되는 캔들스틱 패턴의 일종으로, 일반적으로 추세 반전 신호로 간주됩니다.
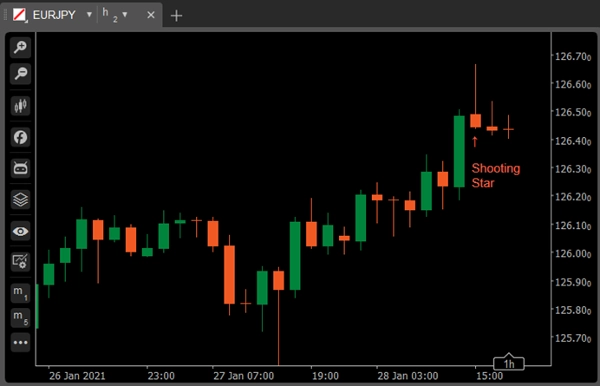
변형: 슈팅 스타
슈팅 스타는 인버티드 해머와 정확히 같아 보이지만, 하락 추세에서 발견되는 대신 상승 추세에서 발견되어 다른 의미를 가집니다.
마루보즈
그림자나 꼬리가 없는 긴 또는 일반 캔들스틱(빨간색 또는 녹색). 고가와 저가는 시가와 종가를 나타냅니다. 지속 패턴으로 간주됩니다.
변형: 마루보즈 오픈
마루보즈 오픈의 경우 시가가 평평해야 합니다. 즉, 가격 움직임이 한 방향으로만 움직여야 하지만, 마루보즈 전체 캔들과 달리 종가는 고가/저가와 약간 다를 수 있습니다. 다시 말해, 시가는 평평해야 하며 반대편에 짧은 심지가 있을 여지가 있습니다.
변형: 마루보즈 클로즈
마루보즈 클로즈 캔들은 마루보즈 오픈과 반대입니다. 종가는 평평해야 하며 가격 움직임은 한 방향으로 공격적으로 거래되기 전에 약간 반대 방향으로 움직일 수 있습니다.
강세 포옹형
작은 빨간 몸통이 다음 큰 녹색 캔들스틱 안에 포함되어 있습니다. 바닥에서 나타나면 주요 반전 신호로 해석됩니다.
약세 포옹형
작은 녹색 몸통이 다음 큰 빨간 캔들스틱 안에 포함되어 있습니다. 상단에서 나타나면 주요 반전 신호로 간주됩니다.
피어싱 라인
피어싱 라인은 빨간 캔들스틱 다음에 오는 녹색 캔들스틱으로, 이전 캔들스틱의 저가보다 낮게 열리지만 빨간 몸통 캔들스틱의 절반 이상을 닫습니다. 바닥에서 나타나면 반전 신호로 간주됩니다.
다크 섀도우 커버
긴 녹색 캔들스틱 다음에 오는 빨간 캔들스틱으로, 녹색 캔들스틱의 고가 위에서 열리고 녹색 몸통 안쪽 깊숙이 닫힙니다. 상승 추세 중에 약세 반전 신호로 간주됩니다.
강세 하라미
비정상적으로 큰 빨간 몸통 다음에 작은 녹색 몸통이 따라오며(큰 빨간 몸통 안에 포함됨), 하락 추세에 앞서 나타나면 강세 패턴으로 간주됩니다.
변형: 강세 하라미 크로스
큰 빨간 몸통 다음에 도지가 옵니다. 바닥에서 나타나면 반전 신호로 간주됩니다.
약세 하라미
비정상적으로 큰 녹색 몸통 다음에 작은 빨간 몸통이 따라오며(큰 녹색 몸통 안에 포함됨), 상승 추세에 앞서 나타나면 약세 패턴으로 간주됩니다.
변형: 약세 하라미 크로스
큰 녹색 몸통 다음에 도지가 옵니다. 상단에서 나타나면 반전 신호로 간주됩니다.
강세/약세 키커
강세 키커 신호는 종종 시장 시간 전후에 발표되는 주요 뉴스의 놀라움 이후에 발생합니다. 무언가 극적인 일이 발생하여 투자자 심리에 큰 변화가 생기고, 반전이 불가피하게 뒤따릅니다. 두 캔들 사이의 간격이 클수록 신호가 더 중요합니다.
모닝/이브닝 스타
큰 녹색 몸통 캔들스틱 다음에 이전 캔들스틱보다 위에 갭이 있는 작은 몸통 캔들스틱(빨간색 또는 녹색)이 옵니다. 세 번째는 큰 녹색 몸통 안쪽 깊숙이 닫히는 빨간 몸통 캔들스틱입니다. 상단 수준에서 나타나면 반전 신호로 간주됩니다.
변형: 어밴던드 베이비
쓰리 그린 솔저스/쓰리 레드 크로우
연속적으로 종가가 높아지는 세 개의 긴 녹색 캔들스틱으로 구성됩니다. 종가는 고가 근처 또는 고가에 있습니다. 바닥에서 나타나면 바닥 반전 신호로 해석됩니다.
연속적으로 종가가 낮아지는 세 개의 긴 빨간 캔들스틱으로 구성됩니다. 종가는 저가 근처 또는 저가에 있습니다. 상단에서 나타나면 상단 반전 신호로 간주됩니다.
쓰리 라인 스트라이크
쓰리 라인 스트라이크는 추세 방향으로 세 개의 캔들스틱이 이어지고 마지막 캔들이 시작점으로 되돌아오는 지속 그룹입니다. 트레이더들은 최근 추세 저점에서 매수하거나 최근 고점에서 매도할 기회로 이 패턴을 사용합니다.
투 레드 갭핑
약세 투 레드 갭핑 지속 패턴은 상승 추세에서 눈에 띄는 고점 이후에 나타나며, 두 개의 빨간 막대가 더 낮은 저가를 기록하는 갭 다운으로 이어집니다. 이 패턴은 하락이 더 낮은 저점까지 계속될 것을 예측합니다.
요약
고객 리뷰
5 | 100 % | |
4 | 0 % | |
3 | 0 % | |
2 | 0 % | |
1 | 0 % |


