
설명
시장이 이 새로운 방향으로 계속 움직인다면, 어느 시점에서 반대 방향 거래의 이익이 초기 거래의 손실을 추월하게 되고, 그 시점에서 두 거래를 모두 종료할 수 있습니다.
시장이 이전 방향으로 돌아가면, 더 큰 로트 크기를 가진 반대 거래가 초기 거래가 이익을 얻는 것보다 더 빠르게 손실을 누적합니다. 이 상황에서는 초기 거래와 세 번째 거래가 두 번째 거래보다 더 커지도록 초기 방향으로 또 다른 거래를 엽니다.
이러한 왔다 갔다 하는 헤징 전략은 가격 움직임이 어느 한 방향으로 돌파할 때까지 계속될 수 있습니다.
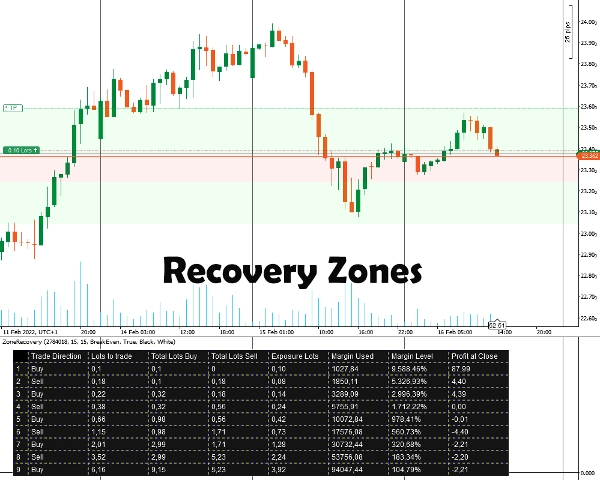
존 리커버리 지표 사용 방법
먼저, 헤징하려는 포지션 ID를 입력해야 합니다. 포지션은 반드시 이익 목표가 있어야 합니다. 그 후, 헤징을 시작해야 한다고 생각하는 핍 수를 입력하여 존 리커버리 크기를 선택합니다. 지표는 전략이 작동할 수 있도록 존과 표를 표시합니다.
모든 후속 포지션에 대해 주문, 손절매 및 이익 실현 목표를 수동으로 설정해야 합니다.
중요 정보
무엇보다도, 거래 계좌는 헤징 유형 계좌여야 합니다.
- 본질적으로 이것은 위험이 수반되는 마틴게일 전략입니다. 초기 거래가 횡보 시장에서 열리면 빠르게 마진이 소진될 수 있습니다. 더 나은 결과를 위해 변동성/추세가 있는 상품이 필요합니다.
- 수수료가 낮거나 스프레드가 작은 거래 상품이 더 잘 작동합니다.
- 초기 거래가 최소 로트 크기로 이루어진 경우, 잘못된 수수료 계산과 미래 거래의 로트 크기 반올림으로 인해 후속 계산이 약간 부정확할 수 있습니다.
- 계좌 통화와 다른 상품을 거래하는 경우, 환율 변동으로 인해 마진 계산이 약간 어긋날 수 있습니다. (예: EUR 계좌, GBP/USD 포지션 오픈)
- 스왑은 고려되지 않습니다.
지표 옵션
지표는 아래 옵션을 제공합니다:
- 포지션 ID - 헤징 표를 계산하려는 열린 포지션 ID입니다. 초기 “PID” 없이 숫자만 입력할 수 있습니다.
- 존 리커버리 핍 - 계산에 고려할 존 리커버리 핍 수입니다. 존 리커버리 종료 시, 초기 거래와 반대 방향의 거래가 열려야 합니다.
- 계산 모드
두 가지 모드가 있습니다: 손익분기점과 이익
손익분기점: 모든 거래가 종료될 때 손실이 없거나 최소가 되도록 로트 크기를 계산합니다. 마진 소진이 느립니다.
이익: 초기 열린 거래의 이익 목표를 달성하기 위해 로트 크기를 계산합니다. 마진 소진이 빠릅니다. - 존 리커버리 영역 그리기 - 차트에 존 리커버리 영역을 그리고 싶으면 예를 선택하세요.
- 표 색상 / 글꼴 색상 - 헤징 표의 색상 옵션입니다.
요약
지표 프로필
고객 리뷰
5.0
리뷰: 2
5 | 100 % | |
4 | 0 % | |
3 | 0 % | |
2 | 0 % | |
1 | 0 % |
고객 리뷰
February 3, 2025
It helped mostly by making bad ideas easier to skip. Forcing the entry still creates problems.
January 31, 2025
What stood out was the plan becomes easier to stick with. The market context still matters.
상담
자주 묻는 질문(FAQ)
Forex
EURUSD
Commodities
XAUUSD
Martingale
트레이딩 봇, 지표, 플러그인 등 cTrader Store에서 제공되는 상품은 제3자 개발자에 의해 제공되며, 이는 단순히 정보 및 기술적 접근을 목적으로 제공된 것입니다. cTrader Store는 중개인이 아니며, 투자 조언, 개인별 추천 또는 향후 성과에 대한 어떠한 보장도 제공하지 않습니다.
이 작성자의 상품 더 보기


가격
11
판매