
Wissen Sie genau, wann die wichtigsten Märkte öffnen und schließen. FX Market Sessions zeigt die vier wichtigsten Handelssitzungen mit ihren Hoch- und Tiefstständen an und hilft Ihnen, Ihre Einstiege auf die volatilsten Stunden des Tages abzustimmen.
Hauptmerkmale
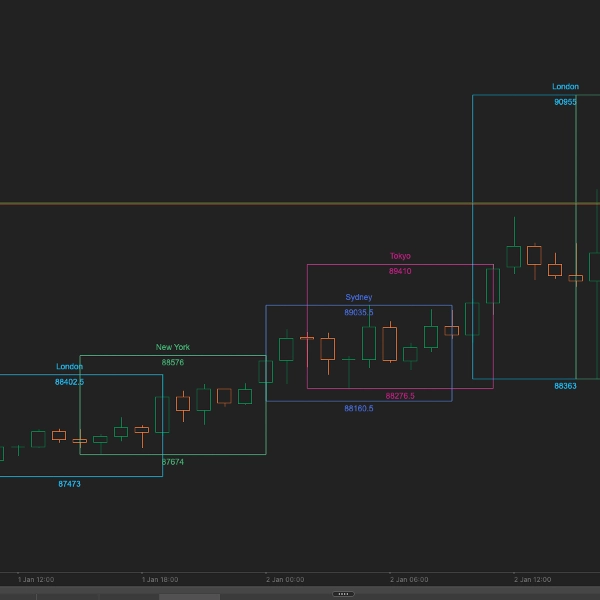
- Vier Hauptsitzungen: Sydney-, Tokio-, London- und New York-Sitzungen mit anpassbaren Start-/Endzeiten und automatischer DST-Anpassung
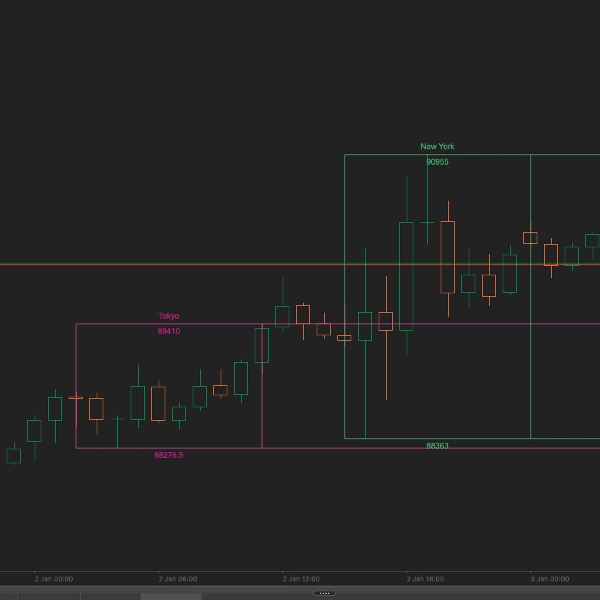
- Sitzungs-Hoch-/Tiefststände: Verfolgt und zeigt automatisch das Hoch und Tief jeder Sitzung mit verlängerbaren Linien für Support-/Resistance-Planung
- Live-Sitzungsanzeige: Echtzeit-Infofeld zeigt an, welche Sitzungen aktuell geöffnet sind – kein Rätselraten mehr, wann London oder New York beginnt
- Historischer Kontext: Anzeige von bis zu 10 Tagen vergangener Sitzungsstände, um zu sehen, wie der Preis an wichtigen Sitzungsgrenzen reagierte
- Volle Anpassung: Wählen Sie, welche Sitzungen angezeigt werden, wählen Sie benutzerdefinierte Farben und entscheiden Sie, ob Hoch-/Tiefststände unendlich verlängert werden sollen
Funktionsweise
Der Indikator berechnet automatisch die vier wichtigsten Forex-Handelssitzungen basierend auf ihren jeweiligen lokalen Zeitzonen:
- Sydney: 21:00-06:00 AEST (passt sich an DST an)
- Tokio: 00:00-09:00 JST
- London: 08:00-17:00 GMT (passt sich an DST an)
- New York: 13:00-22:00 EST (passt sich an DST an)
Jede Sitzung wird als vertikale Zone mit markierten Hoch- und Tiefstständen dargestellt. Das Infofeld oben rechts zeigt in Echtzeit an, welche Sitzungen aktuell geöffnet sind.
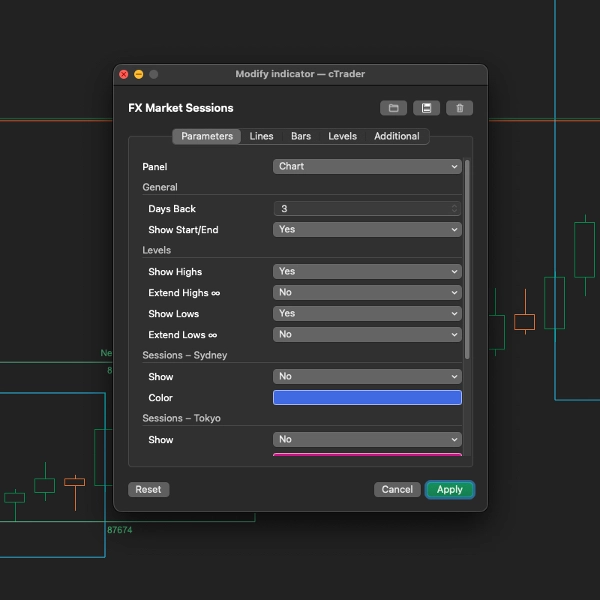
Parameter
Allgemeine Einstellungen
- Tage zurück (Standard: 3): Anzahl der historischen Tage zur Anzeige der Sitzungsboxen (0-10)
- Start/Ende anzeigen (Standard: Wahr): Zeichnet vertikale Linien zu Sitzungsbeginn und -ende
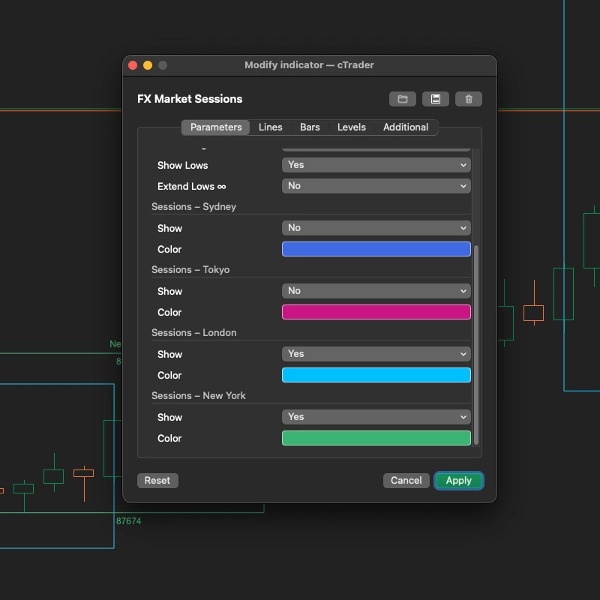
Einstellungen für Level
- Hochs anzeigen (Standard: Wahr): Zeigt das Hoch jeder Sitzung an
- Hochs verlängern (Standard: Falsch): Verlängert Hoch-Linien bis zum rechten Rand des Charts
- Tiefs anzeigen (Standard: Wahr): Zeigt das Tief jeder Sitzung an
- Tiefs verlängern (Standard: Falsch): Verlängert Tief-Linien bis zum rechten Rand des Charts
Sitzungseinstellungen (Sydney, Tokio, London, New York)
- Anzeigen: Aktivieren oder deaktivieren einzelner Sitzungen
- Farbe: Benutzerdefinierte Farbe für die Anzeigeelemente jeder Sitzung
Ideal für
- Daytrader, die wissen müssen, wann die Volatilität zunimmt
- Breakout-Trader, die Sitzungsöffnungen handeln
- Trader, die Sitzungs-Hoch-/Tiefststände als Support/Resistance nutzen
- Jeder, der die besten Handelszeiten visualisieren möchte
Handelstipps
- Londoner Eröffnung: Eine der volatilsten Phasen – bestimmt oft die Richtung des Tages
- London/New York Überlappung: 13:00-16:00 GMT hat typischerweise das höchste Volumen und die größte Volatilität
- Asiatische Sitzung: Am besten für den Handel mit JPY- und AUD-Paaren geeignet
- Sitzungs-Breakouts: Ein Ausbruch über/unter das Hoch/Tief einer Sitzung kann Fortsetzungsbewegungen signalisieren
Unterstützte Zeitrahmen
Funktioniert optimal auf Zeitrahmen von M5 bis H4. Der Indikator passt die Sitzungsboxen automatisch an die Skala Ihres Charts an.
5 | 100 % | |
4 | 0 % | |
3 | 0 % | |
2 | 0 % | |
1 | 0 % |


