


Penerangan
Peramalan Harga Berdasarkan MACD
Gambaran Keseluruhan
Penunjuk ini menembusi had MACD tradisional dengan bergerak melepasi analisis sejarah, secara inovatif memperkenalkan memori sejarah dan algoritma statistik untuk meramalkan tindakan harga masa depan.
Mekanisme Teras:
- Memori Trend Sejarah: Penunjuk merekodkan pergeseran harga trend MACD lalu (sama ada menaik atau menurun) berbanding dengan titik permulaannya, membina pangkalan data statistik sehingga 50 trend terkini.
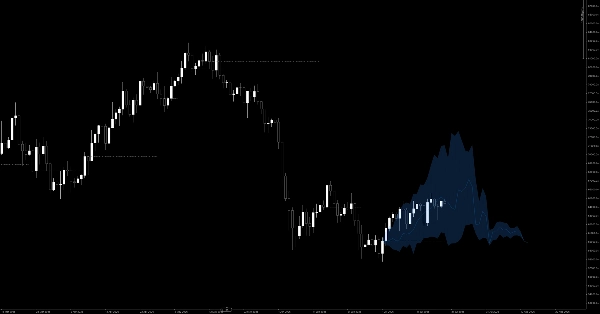
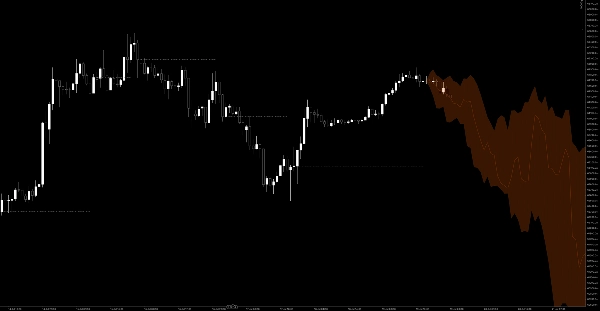
- Kipas Peramalan Kebarangkalian: Apabila berlaku persilangan MACD baru (sama ada melintasi garis sifar atau garis isyarat), penunjuk mengambil data dari memori sejarah. Ia mengira peratusan 20%, 50%, dan 80% perubahan harga dan meramalkan kipas peramalan kebarangkalian untuk 100 bar seterusnya di sebelah kanan carta.
- Awan Kawasan Isyarat Dinamik: Ia menandakan "Harga Rujukan" di mana pembalikan trend bermula. Apabila harga masa nyata berada di atas harga rujukan ini dalam trend menaik, ia melukis kawasan awan hijau; sebaliknya, ia melukis awan merah dalam trend menurun. Ini memberikan pengesahan visual segera tentang momentum menaik atau menurun sebenar.
(Nota: Penunjuk ini menampilkan rendering grafik yang sangat dioptimumkan, menggunakan penggabungan poligon tanpa gangguan untuk zon visual yang jelas dan garis rujukan tidak berterusan yang halus untuk pengalaman carta yang sangat bersih.)
Peraturan Perdagangan & Panduan Pengguna
Penunjuk ini melangkaui isyarat "beli/jual pada persilangan" yang mudah—ia menyediakan anda dengan peta jalan probabilistik untuk perdagangan anda.
1. Mencari Masuk (Pengesahan Trend)
- Masuk Panjang: Apabila berlaku persilangan MACD menaik, sebuah kipas peramalan biru yang memproyeksikan ke atas akan muncul di sebelah kanan. Jangan terburu-buru masuk secara membuta tuli. Tunggu untuk melihat jika harga stabil di atas garis titik-titik (Harga Rujukan) dan sebuah awan hijau menaik mula berkembang. Ini mengesahkan bahawa momentum semasa sepadan dengan statistik sejarah menaik, memberikan peluang kukuh untuk membeli pada penurunan.
- Masuk Pendek: Apabila berlaku persilangan MACD menurun, sebuah kipas peramalan jingga yang memproyeksikan ke bawah akan muncul. Cari harga yang kekal di bawah garis rujukan dengan awan merah menurun yang berkembang untuk mengesahkan masuk pendek pada penarikan balik.
2. Menetapkan Sasaran Ambil Untung
Kipas peramalan berfungsi sebagai panduan ambil untung dinamik yang sangat baik:
- Sasaran 1 (Garis Tengah): Garis tengah di dalam kipas mewakili peratusan sejarah 50% (trajektori purata). Apabila harga menyentuh garis ini, ia bermakna pergerakan semasa telah mencapai purata sejarah, menjadikannya tempat yang ideal untuk mengambil sebahagian keuntungan.
- Sasaran 2 (Tepi Luar Kipas): Sempadan atas (peratusan 80%) atau sempadan bawah (peratusan 20%) mewakili ekstrem sejarah. Jika harga mencapai tepi ini, momentum sangat kehabisan tenaga, dan pembalikan atau penarikan balik mendalam sangat mungkin berlaku. Pertimbangkan untuk menutup keseluruhan posisi.
3. Penempatan Stop Loss Saintifik
- Garis putus-putus kelabu (Harga Rujukan) berfungsi sebagai garis asas untuk setiap trend.
- Apabila masuk panjang, letakkan stop loss anda sedikit di bawah garis kelabu ini. Jika harga menembusi harga rujukan dan awan hijau hilang, ia bermakna tindakan harga sebenar telah membatalkan kebarangkalian menaik sejarah. Susunan trend telah gagal, dan anda harus segera memotong kerugian.
4. Penapis Pasaran Ranging
- Jika berlaku persilangan MACD tetapi kipas peramalan yang diramalkan kelihatan sangat rata atau mengecil, ini bermakna secara sejarah, persilangan serupa hanya menghasilkan tindakan yang tidak menentu dan mendatar.
- Apabila anda melihat kipas rata, duduk diam dan elakkan berdagang. Tunggu kitaran seterusnya di mana kipas menunjukkan pengembangan jelas ke atas atau ke bawah.
Ringkasan
Key features include a probability forecasting fan that projects 20%, 50%, and 80% price change percentiles for the next 100 bars following a MACD crossover. The indicator visually displays this fan on the chart, with blue fans for bullish signals and orange for bearish. A dynamic signal area cloud highlights momentum: green for confirmed uptrends above a reference price and red for downtrends below it.
Trading guidance involves waiting for price confirmation above or below the reference price and cloud before entering long or short positions. The forecasting fan also serves as a dynamic take-profit guide, with the middle line representing average historical moves and outer edges indicating potential trend exhaustion. Stop-loss placement is recommended just beyond the reference price line to manage risk.
Additionally, the indicator filters ranging markets by identifying flat or contracted fans, signaling sideways price action and advising traders to avoid entering trades during such periods. The indicator supports visualization outputs and is tagged under MACD and momentum indicators.





















