
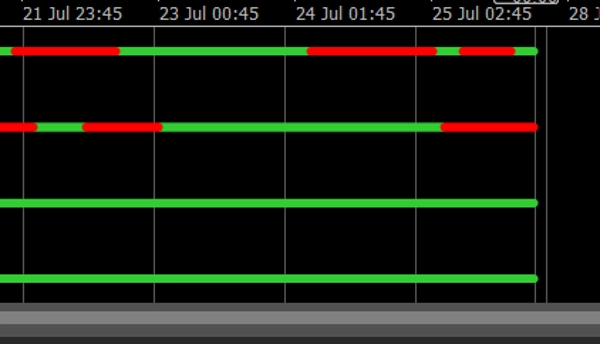
多时间框架趋势点 是一个为 cTrader 构建的强大且极简的趋势指标。它允许交易者 直观地跟踪趋势方向 跨越 最多 4 个可选时间框架,使用简单但有效的颜色编码点线。
✅ 绿色 = 上升趋势
✅ 红色 = 下降趋势
✅ 简洁布局 于单一子窗口中
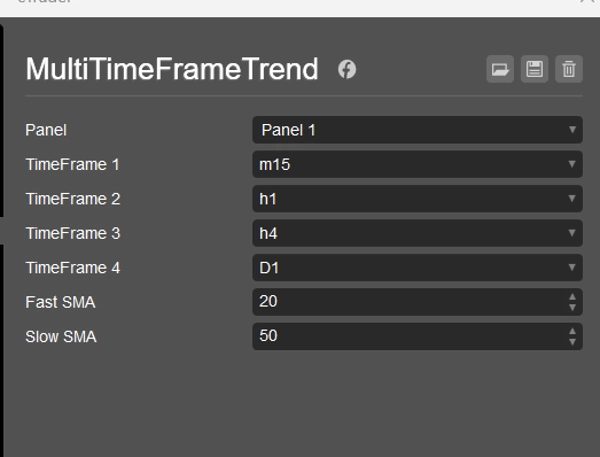
✅ 可自定义 SMA 快速/慢速设置
✅ 适用于 任何符号和时间框架
无论您是 剥头皮交易者、日内交易者还是波段交易者,此指标为您提供多时间框架对齐的快速概览——非常适合做出自信的入场决策或过滤不良设置。
💼 包含:
- 基于 SMA 交叉的趋势逻辑
- 4 级点位放置(为可读性调整)
- 每条趋势线末端的时间框架标签
- 完全兼容所有 cTrader 版本
🎁 策略构建或手动交易的完美伴侣。
指标配置
4.0
评价:3
5 | 0 % | |
4 | 100 % | |
3 | 0 % | |
2 | 0 % | |
1 | 0 % |
客户评价
August 10, 2025
July 30, 2025
The main upside is it brings another read without hijacking the plan, and one green trade proves nothing.
July 29, 2025
The reason it feels usable is the process slows down in a good way, and a 1R exit plan makes review easier.
cTrader Store 提供的所有产品,包括交易机器人、指标和插件,均由第三方开发者提供,仅供信息参考和技术访问之用。cTrader Store 并非经纪商,不提供投资建议、个人推荐或任何未来业绩保证。
该作者的其他作品


猜您喜欢


注册日期 21/01/2025
3
销售