
Description
Indicateur Amélioré de Support et Résistance
Libérez la puissance de l'analyse technique avec notre Indicateur Amélioré de Support et Résistance pour cAlgo. Cet outil avancé est conçu pour aider les traders à identifier et visualiser les niveaux critiques de support et de résistance sur leurs graphiques de trading, améliorant ainsi la prise de décision et les stratégies de trading.
Caractéristiques principales :
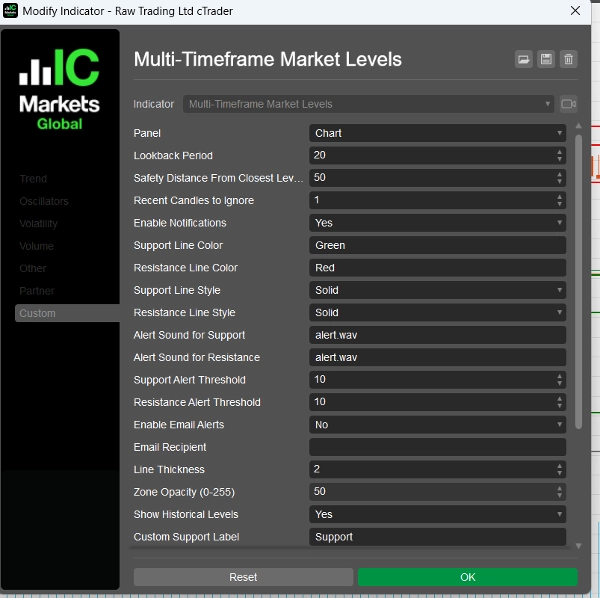
- Paramètres Personnalisables : Adaptez l'indicateur à votre style de trading avec des réglages ajustables, incluant les périodes de retour en arrière, les distances de sécurité, les sons d'alerte, et plus encore.
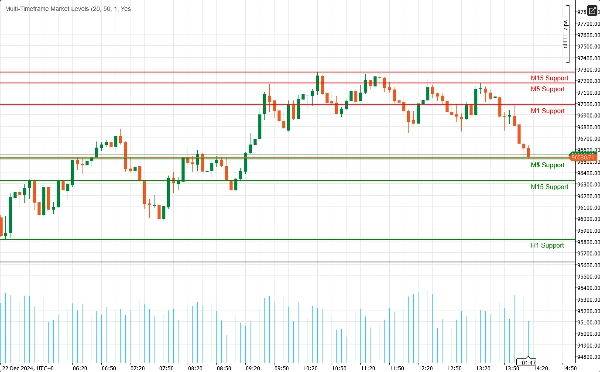
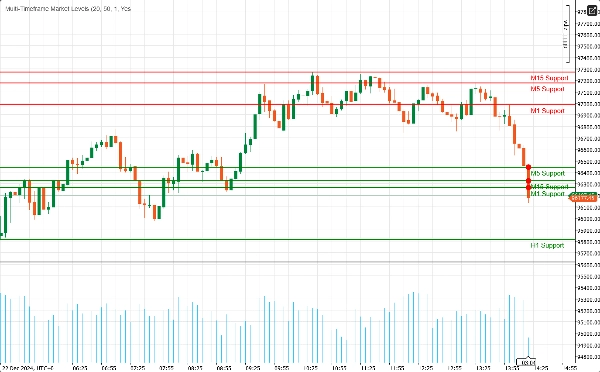
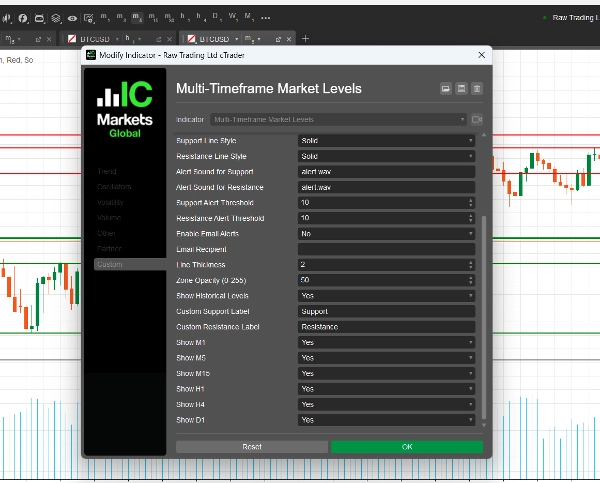
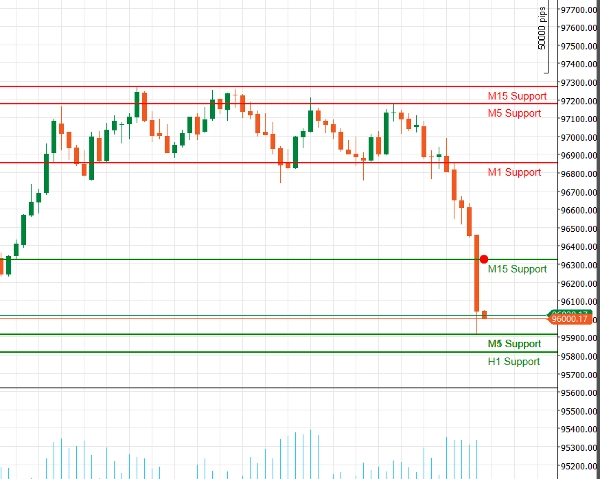
- Support Multi-Échelles de Temps : Analysez plusieurs échelles de temps simultanément (M1, M5, M15, H1, H4, D1) pour obtenir une vue complète de la dynamique du marché et identifier les niveaux clés sur différents horizons de trading.
- Alertes en Temps Réel : Restez informé grâce à des notifications instantanées ! L'indicateur peut envoyer des alertes sonores et des notifications par email lorsque le prix approche des niveaux critiques de support ou de résistance, vous assurant de ne jamais manquer une opportunité de trading.
- Clarté Visuelle : Profitez de représentations visuelles claires des niveaux de support et de résistance, complétées par des couleurs et styles de lignes personnalisables. Les zones mises en évidence fournissent un contexte supplémentaire, facilitant la détection des points potentiels de retournement.
- Intégration de Fibonacci : Améliorez votre analyse avec le tracé intégré des niveaux de Fibonacci, vous permettant d'identifier les niveaux potentiels de retracement et d'extension en conjonction avec le support et la résistance.
- Interface Conviviale : Conçu pour les traders débutants comme expérimentés, l'indicateur est facile à configurer et s'intègre parfaitement dans votre environnement cAlgo existant.
Comment utiliser l'Indicateur Amélioré de Support et Résistance
- Installation :
-
- Téléchargez l'indicateur et importez-le dans votre plateforme cAlgo.
- Attachez l'indicateur au graphique souhaité.
- Configurer les Paramètres :
-
- Ajustez les réglages pour correspondre à votre style de trading. Définissez la période de retour en arrière, la distance de sécurité, et choisissez vos couleurs et styles de ligne préférés pour les niveaux de support et de résistance.
- Activez les notifications si vous souhaitez recevoir des alertes lorsque le prix approche ces niveaux.
- Sélectionner les Échelles de Temps :
-
- Choisissez les échelles de temps que vous souhaitez afficher. Vous pouvez choisir d'afficher ou de masquer les niveaux de M1, M5, M15, H1, H4 et D1, selon votre stratégie de trading.
- Analyser le Graphique :
-
- Observez les niveaux de support et de résistance tracés sur votre graphique. Ces niveaux indiquent où le prix est susceptible de rebondir ou de se consolider.
Comment trader avec l'Indicateur Amélioré de Support et Résistance
- Identifier les Points d'Entrée :
-
- Positions Longues : Recherchez des opportunités d'achat lorsque le prix approche un niveau de support, surtout s'il montre des signes de rebond (par exemple, des configurations de chandeliers haussiers).
- Positions Courtes : Envisagez de vendre lorsque le prix s'approche d'un niveau de résistance, particulièrement s'il y a des signaux baissiers (par exemple, des configurations de chandeliers baissiers).
- Utilisation des Alertes :
-
- Utilisez les alertes en temps réel pour vous notifier lorsque le prix approche des niveaux clés de support ou de résistance. Cela vous permet d'agir rapidement et de profiter des opportunités de trading potentielles.
- Combinaison avec d'Autres Indicateurs :
-
- Améliorez votre stratégie en combinant l'Indicateur Amélioré de Support et Résistance avec d'autres indicateurs techniques (par exemple, Moyennes Mobiles, RSI, MACD) pour confirmer les signaux et améliorer la précision de vos trades.
- Définition des Niveaux de Stop-Loss et Take-Profit :
-
- Placez les ordres stop-loss juste en dessous des niveaux de support pour les positions longues et juste au-dessus des niveaux de résistance pour les positions courtes afin de gérer le risque.
- Fixez les objectifs take-profit au niveau de support ou de résistance significatif suivant pour maximiser les gains potentiels.
Pourquoi choisir Enhanced Support Resistance ?
Naviguer dans les complexités des marchés financiers peut être un défi. L'Indicateur Amélioré de Support et Résistance vous équipe des outils nécessaires pour identifier les niveaux de prix clés et prendre des décisions de trading éclairées. Que vous soyez un trader journalier ou un investisseur à long terme, cet indicateur est un ajout essentiel à votre boîte à outils de trading.
Résumé
Avis clients
5 | 100 % | |
4 | 0 % | |
3 | 0 % | |
2 | 0 % | |
1 | 0 % |


![Logo de "[Hamster-Coder] Pivot Points MTF"](https://cdn.ctrader.com/image/webp/4c143e5a-309c-40e3-a578-f04d1e133ffa_31159)


