
LaguerreRSI
Indicateur
1 achats
Version 1.0, Jul 2025
Windows, Mac
5.0
Avis : 1
Description
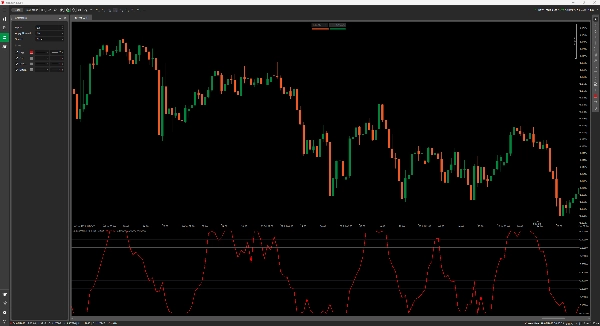
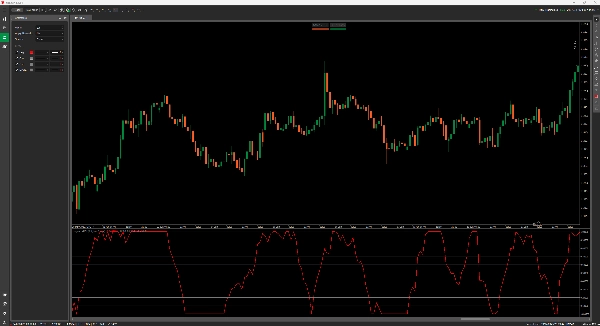
Laguerre RSI – Oscillateur lisse pour un timing précis
Cet indicateur applique le filtre de Laguerre au RSI, offrant un oscillateur plus lisse et réagissant plus rapidement qui coupe à travers le bruit du marché. L'alpha ajustable vous permet de régler la réactivité. Normalisez éventuellement la sortie de 0 à 100 pour une détection plus facile des zones de surachat/survente.
Caractéristiques :
- RSI ultra-lisse basé sur la transformation de Laguerre
- Alpha personnalisable pour le contrôle de la sensibilité
- Normalisation optionnelle de 0 à 100 pour une sensation standard de RSI
- Niveaux de référence intégrés de surachat, survente et milieu
- Idéal pour repérer les retournements précoces et l'épuisement à court terme
À utiliser de préférence dans les marchés en range ou comme outil de confirmation lors des replis de tendance. Beaucoup moins de latence que le RSI traditionnel.
Résumé
Résumé IA
LaguerreRSI is a technical indicator that applies the Laguerre filter to the traditional Relative Strength Index (RSI) to produce a smoother and faster-reacting oscillator. This approach reduces market noise and lag, enhancing the precision of timing entries and spotting early reversals. The indicator features an adjustable alpha parameter, allowing users to control sensitivity and responsiveness. It can optionally normalize output values to a 0–100 scale, similar to standard RSI, facilitating easier identification of overbought, oversold, and middle reference levels. LaguerreRSI is particularly suited for use in ranging markets or as a confirmation tool during trend pullbacks. Its design aims to provide clearer signals of short-term exhaustion and potential market turning points.
Profil de l'indicateur
Avis clients
5.0
Avis : 1
5 | 100 % | |
4 | 0 % | |
3 | 0 % | |
2 | 0 % | |
1 | 0 % |
Discussion
Questions fréquentes
Les produits disponibles sur cTrader Store, notamment les bots de trading, les indicateurs et les plug-ins, sont fournis par des développeurs tiers et mis à disposition à titre informatif et à des fins d'accès technique uniquement. cTrader Store n'est pas un courtier et ne fournit aucun conseil en investissement, aucune recommandation personnelle ni aucune garantie quant aux performances futures.


Prix
Depuis le 03/01/2025
638.03K
Volume tradé
21.34K
Pips gagnés
15
Ventes