
Description
Supertrend Channels est un indicateur superposé personnalisé conçu pour aider les traders à identifier visuellement des zones dynamiques de support et de résistance, des signaux d'entrée, et des niveaux de stop-loss suiveur utilisant une logique basée sur l'ATR.
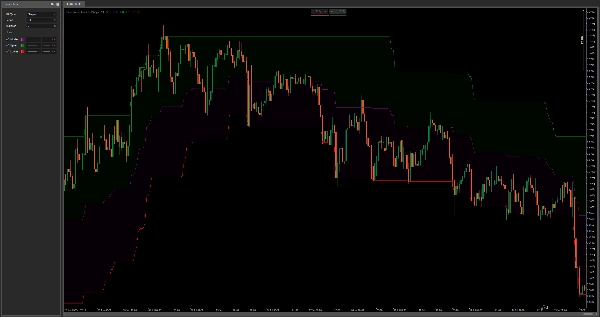
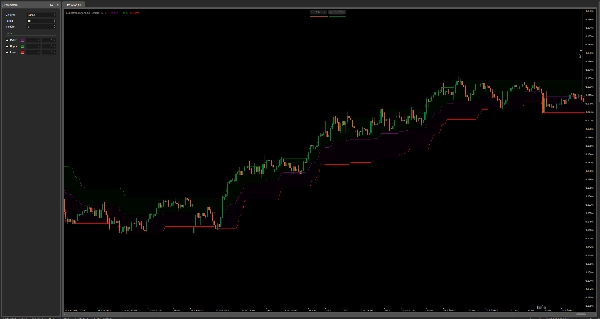
L'indicateur trace trois lignes :
- Bande Supérieure (Vert) – agit comme une résistance dynamique ou un stop-loss suiveur pour les positions longues.
- Bande Inférieure (Rouge) – agit comme un support dynamique ou un stop-loss suiveur pour les positions courtes.
- Ligne Médiane (Violet) – sert de niveau de retour à la moyenne ou de point d'entrée potentiel.
Elle calcule les bandes en utilisant la Moyenne Vraie Plage (ATR) multipliée par un facteur défini par l'utilisateur (Multiplier) et ajoute/soustrait cela au plus haut/plus bas de la bougie actuelle. Une méthode de lissage (type de MA sélectionnable) est appliquée à l'ATR pour ajuster la réactivité.
Comment l'utiliser :
- Entrée : Cherchez des entrées près de la ligne médiane lors des consolidations ou après des signaux de croisement.
- Stop-Loss Suiveur : Utilisez les bandes supérieure/inférieure comme zones de sortie dynamiques pour sécuriser les profits à mesure que les tendances se prolongent.
- Support & Résistance : Ces bandes agissent comme des zones adaptatives qui reflètent la volatilité récente et aident à repérer les points de retournement potentiels.
Contrairement aux Bandes de Bollinger standard, cette approche ancre les bandes sur les extrêmes de prix plus la volatilité, et non sur une moyenne mobile, ce qui la rend plus réactive dans les environnements de tendance et plus adaptable pour le trading discrétionnaire ou algorithmique.
Résumé
Avis clients
5 | 50 % | |
4 | 50 % | |
3 | 0 % | |
2 | 0 % | |
1 | 0 % |


![Logo de "[Stellar Strategies] Inside Bar with Signals"](https://cdn.ctrader.com/image/webp/1d9e8bfa-3b2c-4440-bb37-5856902008a7_30683)


