
Description
MACD Custom MTF (Multiple Time Frame) v1.1 est un outil avancé qui fusionne la puissance éprouvée du MACD classique avec l’avantage crucial de l’analyse multi-échelles et une visualisation moderne et intuitive. Conçu pour les traders exigeants qui demandent précision, interprétation rapide et capacité à adapter les outils à leur stratégie unique.
Nouveautés de la version 1.1 :
- Visuels 100 % fluides : Correction des lignes MACD cassées/discontinues – les lignes sont désormais parfaitement continues lors des changements de tendance.
- Meilleure visibilité : Augmentation de la taille des points de signal Achat/Vente, épaississement de la ligne de signal et de l’histogramme pour une vue cristalline. Atténuation de la ligne zéro pour réduire la fatigue oculaire.
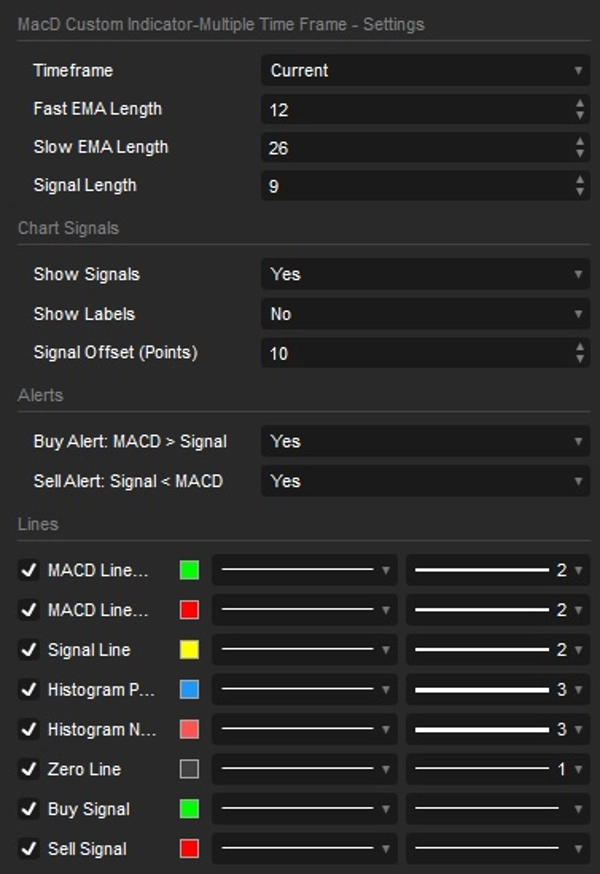
- Alertes intelligentes et simplifiées : Nettoyage de la fenêtre des paramètres. Il suffit d’activer « Alerte Achat » ou « Alerte Vente » et l’indicateur gère automatiquement les popups à l’écran et les notifications sonores correctes.
- Paramètres organisés : Tous les paramètres sont désormais joliment regroupés en catégories intuitives pour une bien meilleure expérience utilisateur.
- Localisation complète en anglais : Tous les messages de journal, popups et erreurs ont été entièrement localisés en anglais.
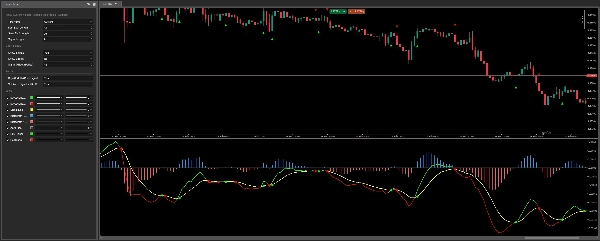
Analyse multi-échelles (MTF) sur un seul graphique :
Fini le jonglage entre les graphiques ! Affichez les données MACD d’une échelle supérieure (par ex., H1, H4, D1) directement sur votre graphique de travail actuel (par ex., M5, M15). Obtenez un contexte de marché plus large inestimable, identifiez les tendances sous-jacentes dominantes et filtrez efficacement le bruit trompeur des échelles inférieures. Entièrement configurable – choisissez parmi une liste complète d’échelles, de la minute au mensuel.
Coloration dynamique du MACD et de la ligne de signal :
Confirmation instantanée de la tendance : la ligne MACD change dynamiquement de couleur lorsqu’elle croise sa ligne de signal, illustrant vivement un momentum haussier ou baissier. Plus de conjectures – la couleur de la ligne vous indique immédiatement si le MACD est au-dessus (haussier) ou en dessous (baissier) de sa ligne de signal.
Histogramme cristallin :
Visualisez facilement la divergence (force) entre le MACD et sa ligne de signal. L’indicateur colore intuitivement les barres épaissies selon qu’elles sont positives (bleu) ou négatives (rouge), offrant un aperçu profond des changements de momentum en un coup d’œil.
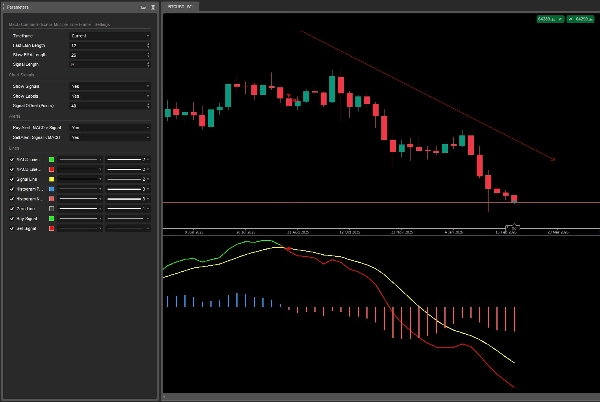
Signaux de croisement visuels incontestables :
Ne manquez plus jamais un croisement critique ! L’indicateur met automatiquement en évidence les croisements MACD/ligne de signal. Il trace des points distincts et très visibles directement sur votre graphique de prix (avec un décalage ajustable) et propose des étiquettes textuelles optionnelles « Achat »/« Vente » pour une clarté ultime.
Alertes intelligentes intégrées :
Comprend des notifications Popup et Son intégrées, sans tracas, pour les signaux d’achat et de vente. Restez informé de chaque opportunité sans être scotché à votre écran ! Il suffit d’activer les alertes dans les paramètres et de laisser l’indicateur surveiller pour vous.
Personnalisation complète à portée de main :
- Personnalisez les longueurs des EMA rapide, EMA lente et ligne de signal selon vos spécifications précises.
- Tous les paramètres sont soigneusement organisés en groupes logiques (Paramètres MACD, Signaux graphiques, Alertes) pour des ajustements rapides.
- Activez ou désactivez la visibilité des éléments visuels individuels : lignes MACD & Signal, Histogramme, Signaux de croisement et Étiquettes.
- Décalage de signal ajustable pour correspondre parfaitement à l’esthétique et aux préférences de votre graphique.
Résumé
Key features include dynamic coloring of the MACD and signal lines to indicate bullish or bearish momentum, a crystal-clear histogram that visualizes the divergence between MACD and its signal line with color-coded bars, and unmistakable visual crossover signals marked by distinct dots or arrows on the price chart. The indicator supports integrated alerts with popup and sound notifications for buy and sell signals, configurable via a streamlined settings interface.
Users can fully customize the indicator by adjusting Fast EMA, Slow EMA, and Signal Line lengths, toggling visibility of visual elements (lines, histogram, signals, labels), and modifying colors and line thickness. The settings are organized into intuitive categories for ease of use. This indicator supports a wide range of timeframes from minutes to monthly and is suitable for various markets including Forex, indices, commodities, stocks, and cryptocurrencies.
Avis clients
5 | 100 % | |
4 | 0 % | |
3 | 0 % | |
2 | 0 % | |
1 | 0 % |


