
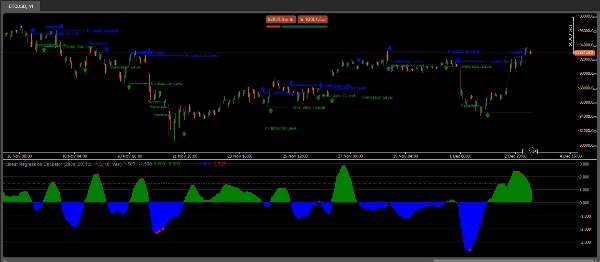
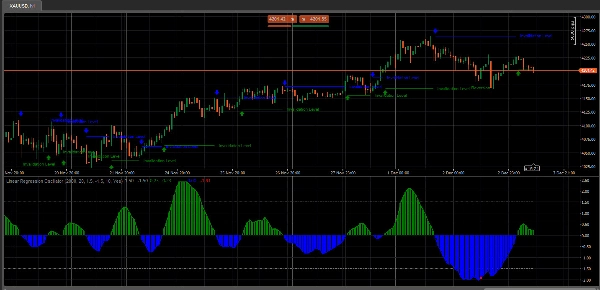
Le Oscillateur de Régression Linéaire (LRO) est un indicateur technique basé sur l'analyse de régression linéaire, couramment utilisé sur les marchés financiers pour évaluer le momentum et la direction des tendances des prix. Il mesure la distance entre le prix actuel et la valeur prédite par une droite de régression linéaire, qui est essentiellement la droite d'ajustement optimal sur une période spécifiée. Voici une explication de son fonctionnement et de ses composants :
Composants clés de l'Oscillateur de Régression Linéaire
- Droite de Régression Linéaire (Droite d'Ajustement) : Cette droite représente le mouvement de prix attendu sur une certaine période et est calculée à l'aide de techniques de régression linéaire. La pente de la droite indique la direction de la tendance : une pente positive suggère une tendance haussière, tandis qu'une pente négative indique une tendance baissière.
- Valeurs de l'Oscillateur : La valeur de l'oscillateur est calculée en mesurant la déviation entre le prix actuel et la droite de régression linéaire. Cette déviation est tracée comme une valeur d'oscillateur, oscillant généralement autour d'une ligne zéro.
- Ligne Zéro : La ligne zéro dans un graphique LRO sert de ligne de base. Lorsque la valeur de l'oscillateur croise au-dessus de la ligne zéro, cela suggère un momentum haussier, et un croisement en dessous suggère un momentum baissier.
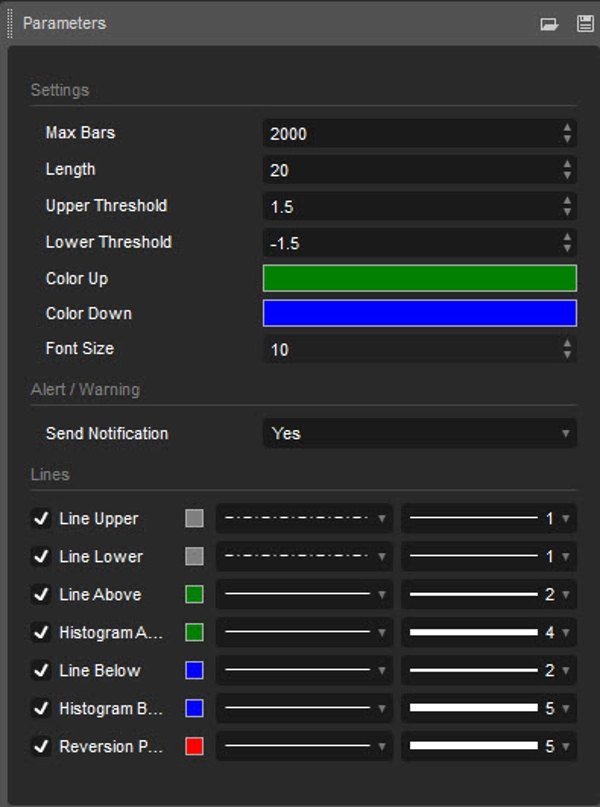
- Paramètres et Périodes : Le paramètre de période définit le nombre de barres ou de points de données pris en compte pour calculer la droite de régression linéaire. Les traders ajustent ce paramètre pour convenir à des stratégies de trading à court ou long terme, selon leur horizon d'analyse préféré.
Comment les Traders Utilisent l'Oscillateur de Régression Linéaire
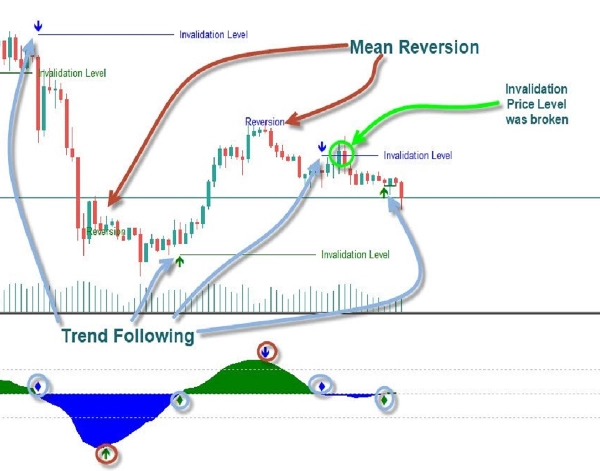
- Identification des Tendances : Le LRO aide les traders à voir si la tendance actuelle des prix a du momentum en montrant la distance relative entre le prix et sa ligne attendue (régression).
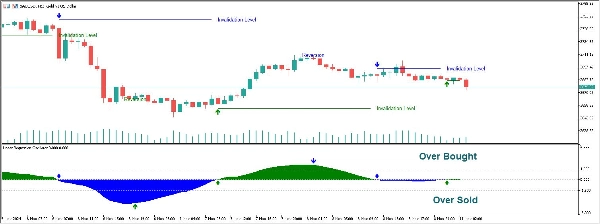
- Niveaux de Surachat/Survente : Les valeurs extrêmes de l'oscillateur peuvent indiquer des conditions de surachat ou de survente, suggérant un retournement potentiel ou la nécessité d'ajuster les positions.
- Signaux de Divergence : Lorsque les mouvements de prix et l'indicateur LRO divergent, cela peut signaler un affaiblissement du momentum ou un possible retournement.
Conseils d'Interprétation
- Croisement de la Ligne Zéro : Un croisement au-dessus de zéro peut indiquer une tendance haussière émergente, tandis qu'un croisement en dessous de zéro suggère une tendance baissière.
- Ajustement des Périodes : Des périodes plus courtes rendent le LRO plus sensible, capturant les mouvements rapides des prix mais augmentant le bruit. Des périodes plus longues lissent les fluctuations, adaptées à l'identification des tendances à plus long terme.
Notes d'Utilisation :
- Longueur : Détermine la période sur laquelle la régression linéaire est calculée
- Seuils Supérieur/Inférieur : Définissent les limites supérieure et inférieure pour identifier les conditions de surachat et de survente. Les valeurs en dehors de ces seuils suggèrent des retournements potentiels.
L'Oscillateur de Régression Linéaire est apprécié pour combiner l'analyse statistique avec les principes de suivi de tendance, en faisant un outil polyvalent pour les traders de momentum et de tendance. Il est particulièrement utile dans les marchés en tendance où il aide à identifier les continuations ou retournements de tendance basés sur les écarts par rapport à la ligne de tendance de régression.
5 | 0 % | |
4 | 100 % | |
3 | 0 % | |
2 | 0 % | |
1 | 0 % |


![Logo de "[Hamster-Coder] Moving Average MTF"](https://cdn.ctrader.com/image/webp/b11b98b1-194d-4b8e-b00e-d611826ad159_31226)


