
说明
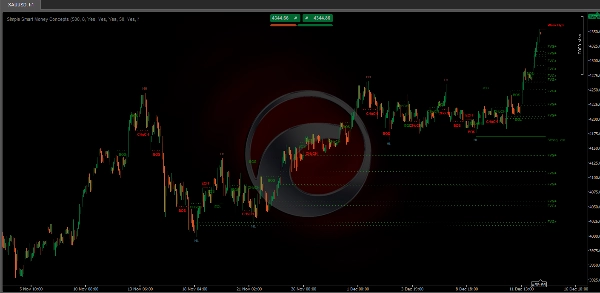
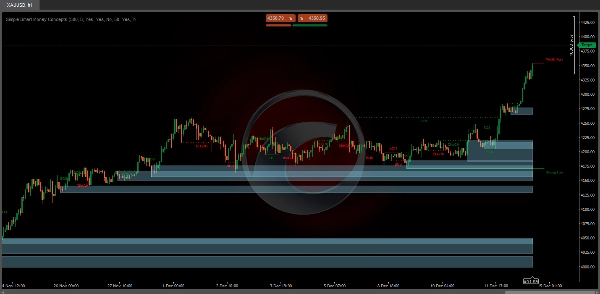
这个简单的智能资金概念指标显示实时市场结构(内部和摆动BOS / CHoCH)、订单区块、溢价和折扣区域、相等的高点和低点,以及更多内容……允许交易者自动使用广泛应用的价格行为方法标记他们的图表。
“智能资金概念”(SMC)是价格行为交易者中常用的术语,旨在更准确地导航流动性并找到市场中更优的关注点。试图确定机构市场参与者下单的位置,是基于价格行为寻找更实用入场和出场点的合理方法。
主要特点
- 实时的内部和摆动市场结构:
-
- 内部结构:这些元素指的是在较小范围或特定交易时段内发生的价格形态和模式。该套件可以检测诸如次级支撑/阻力位或短期趋势反转等复杂细节。
- 外部结构:这些涉及跨多个交易时段或时间框架的更大、更重要的市场模式和趋势。此功能帮助交易者理解整体市场方向。
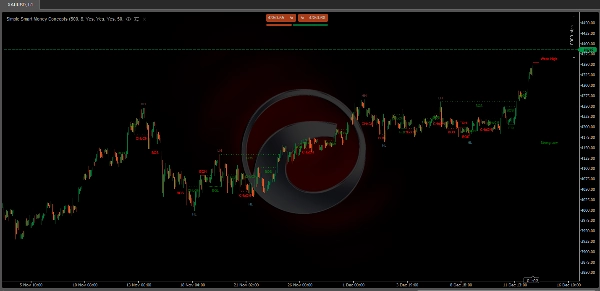
- 高点/低点区域(HH/LH/LL/LH):
-
- 识别更高高点(HH)、更低高点(LH)、更低低点(LL)和更低高点(LH)有助于理解趋势和市场结构,辅助预测分析。
- 结构突破(BOS):
-
- 此功能识别价格突破重要结构的点,可能表明新趋势或趋势反转。
- 特征变化(CHoCH):
-
- 检测市场行为的微妙变化,可能暗示趋势变化的早期阶段,尚未被更广泛的市场察觉。
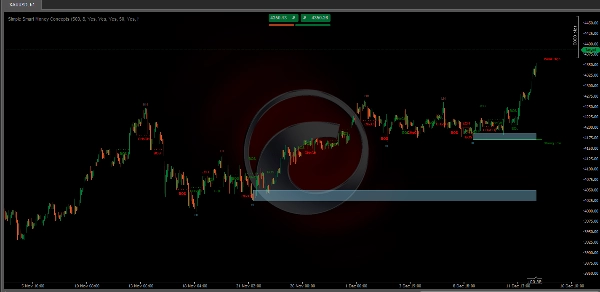
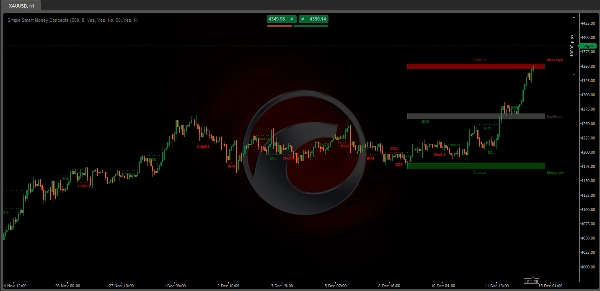
- 订单区块:
-
- 这些本质上是之前发生过重大交易活动的价格水平或区域,可能指向智能资金的位置。
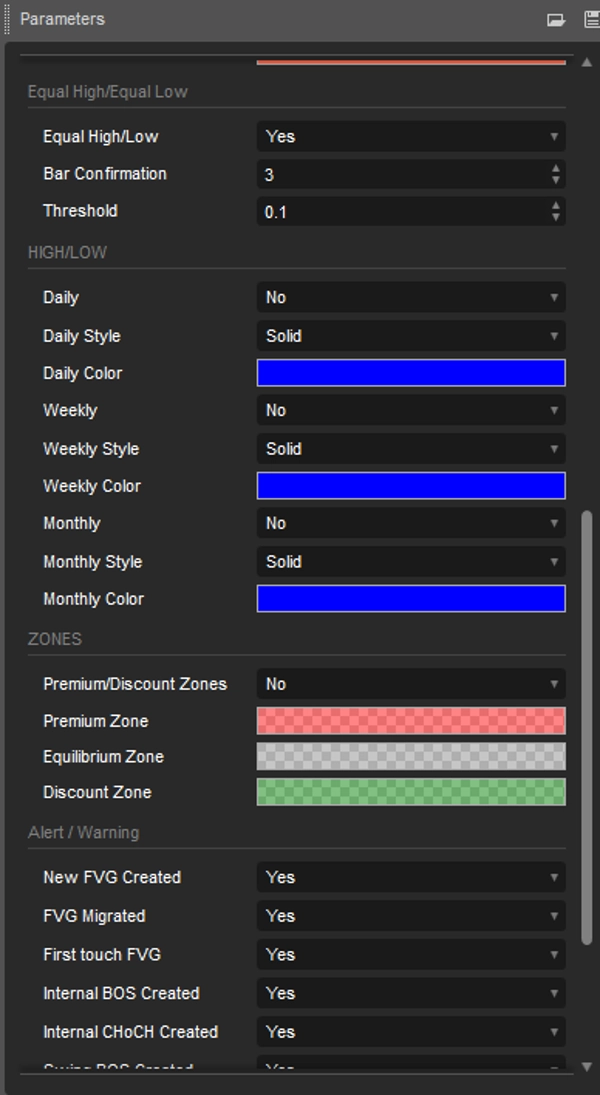
- 相等的高点和低点
-
- 在图表上显示EQH/EQL标签,用于检测相等的高点和低点。
- 公平价值缺口:
-
- 公平价值缺口:一种三根蜡烛的形态,其中中央蜡烛相邻的影线不重叠,突出显示缺口区域。
- 之前的高点和低点:
-
- 允许用户显示来自日线、周线和月线时间框架的之前高点和低点作为重要水平
- 作为区间的溢价和折扣区域:
-
- 允许用户在图表上显示溢价、折扣和平衡区域
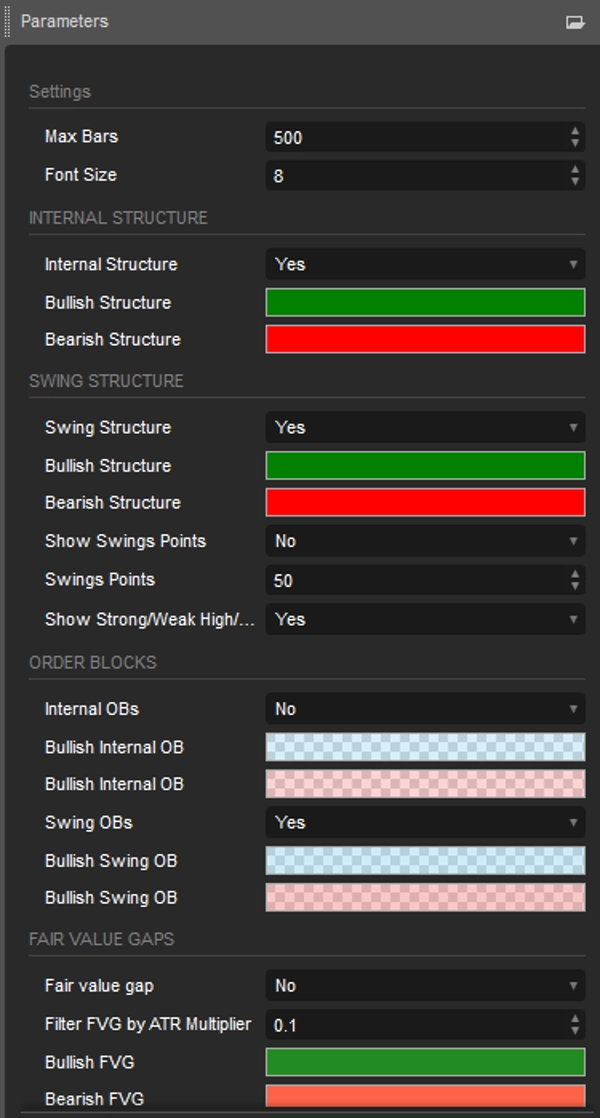
可定制功能
- 用户可以调整数据长度、颜色和显示样式等设置,以匹配他们的交易偏好。
交易者的好处
- 节省手动分析时间,提高交易效率。
- 帮助在波动的市场条件下快速做出明智决策。
- 对初学者和有经验的交易者都易于使用。
结论
这个 简单智能资金概念指标 不仅是一个工具,更是一个为希望有效实施ICT策略的交易者提供的综合解决方案。它是增强市场分析和执行精准交易的强大选择。
摘要
AI 摘要
The Simple Smart Money Concepts (SMC) indicator provides real-time analysis of market structure and price action to assist traders in identifying key trading opportunities. It automatically marks charts with internal and swing market structures, including Higher Highs (HH), Lower Highs (LH), Lower Lows (LL), and Breaks of Structure (BOS). The indicator detects subtle market shifts known as Change of Character (CHoCH) and highlights order blocks—price zones where significant trading activity has occurred, often reflecting institutional interest.
Additional features include the identification of equal highs and lows, fair value gaps (three-candle formations indicating price gaps), and previous highs and lows across daily, weekly, and monthly timeframes. It also displays premium, discount, and equilibrium zones to help traders assess value areas.
Users can customize settings such as data length, colors, and display styles to fit their trading preferences. The indicator supports analysis across multiple markets including Forex, cryptocurrencies (e.g., BTCUSD), stocks, and commodities (e.g., XAUUSD).
Designed to streamline chart analysis, the Simple Smart Money Concepts indicator aids traders in making informed decisions by visually representing widely used price action methodologies and institutional order flow concepts.
指标配置
客户评价
4.3
评价:3
5 | 33 % | |
4 | 67 % | |
3 | 0 % | |
2 | 0 % | |
1 | 0 % |
客户评价
December 15, 2025
Decent tool with caution for a more controlled workflow. It helps with mapping zones before entries, but zones still need manual validation. For SMC logic, I trust zones more when 0.5 mitigation, BOS and liquidity sweep line up. I would still keep manual review in the process.
December 14, 2025
December 14, 2025
Clear helper for setups around smart money style analysis. The useful part is mapping zones before entries, with the numbers checked before scaling. A good sample is 20 FVG or order block reactions, with messy 0.705 areas skipped. The zone is more convincing when structure and risk both make sense.
讨论
常见问答
BTCUSD
Forex
Signal
Fair Value Gap
SMC
Crypto
Stocks
XAUUSD
NAS100
cTrader Store 提供的所有产品,包括交易机器人、指标和插件,均由第三方开发者提供,仅供信息参考和技术访问之用。cTrader Store 并非经纪商,不提供投资建议、个人推荐或任何未来业绩保证。
该作者的其他作品


价格
38
销售
2.35K
免费安装