
说明
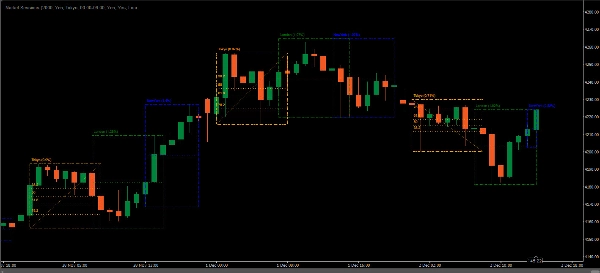
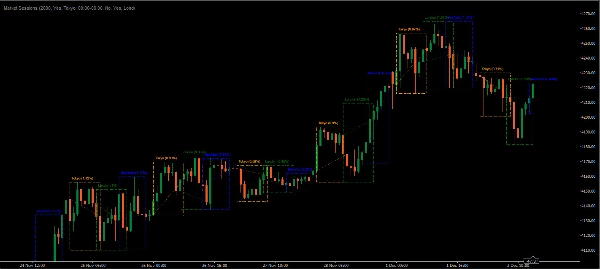
市场时段指标是外汇和股票交易者中流行的工具,用于在价格图表上直观地表示全球交易时段。它突出显示主要交易时段的时间段——例如 亚洲(东京)、 欧洲(伦敦)和 美洲(纽约) 时段——直接显示在图表上。这有助于交易者识别市场的开盘和收盘时间,从而基于特定时段的交易行为做出更好的决策。
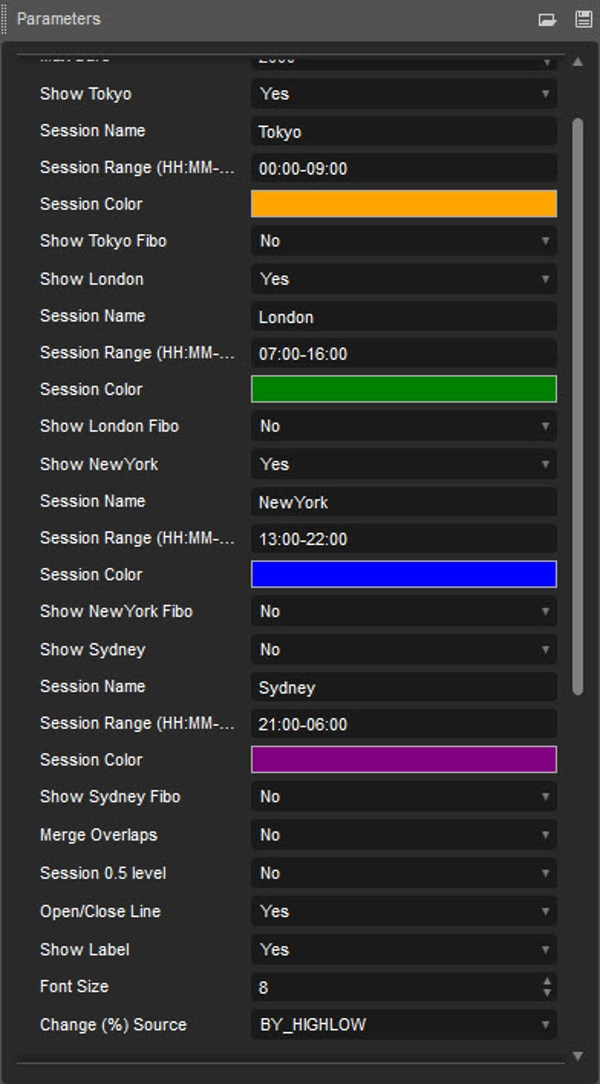
- 亚洲时段(默认:00:00-09:00)
- 伦敦时段(默认:07:00-16:00)
- 纽约时段(默认:13:00-22:00)
- 悉尼时段(默认:21:00-06:00)
市场时段指标的主要特点
- 时段时间及重叠:
-
- 该指标标记每个时段的开始和结束时间。此功能非常有用,因为每个时段都有独特的特征——例如,亚洲时段通常较为平静,而伦敦时段经常出现高波动性。重叠时段,如伦敦-纽约重叠,也会被标记,显示活动增强的时间。
- 可自定义的时段颜色:
-
- 交易者通常可以自定义每个时段的颜色,这使得视觉上区分它们变得容易。这种个性化增加了清晰度,帮助交易者专注于他们可能偏好的特定时段。
- 可调节的时区:
-
- 由于交易者分布全球,该指标通常允许调整时区,使时段的开始和结束时间与交易者的本地时间对齐,这对于位于主要交易中心不同时区的交易者尤其有用。
- 特定时段策略:
-
- 每个时段都有不同的特征。例如,伦敦时段通常波动最大,提供突破机会,而亚洲时段则较为平静,适合区间交易策略。了解这些细微差别使交易者能够根据时段趋势调整他们的策略。
为什么使用市场时段指标?
- 更好的交易时机:
-
- 通过了解当前活跃的时段,交易者可以调整策略,以利用不同的波动性和流动性水平。
- 改进的分析和策略开发:
-
- 通过直观标记的时段时间,交易者可以分析跨时段的价格行为,开发和完善最适合每个时段特征的策略。
- 增强对市场波动性的认识:
-
- 波动性通常在时段开盘、收盘和重叠时段激增。该指标有助于预见这些波动,减少因突发市场变化而措手不及的可能性。
示例用例
一位关注波动性的交易者可能会选择伦敦-纽约重叠时段,以利用更高的市场波动。通过使用市场时段指标,他们可以规划交易与该重叠时段同步,可能增加捕捉显著价格变动的机会。
总之,市场时段指标对于希望基于特定时间的市场行为做出明智决策的交易者来说至关重要。它提供了清晰度,增强了分析能力,并能支持更有效的交易策略。
摘要
AI 摘要
The Market Sessions indicator visually displays major global trading sessions directly on price charts, aiding forex, stock, and crypto traders in identifying active market periods. It highlights the Asian (Tokyo), European (London), American (New York), and Sydney sessions with default time ranges, marking their start and end times as well as overlaps, such as the London-New York overlap known for increased volatility. Traders can customize session colors for clear visual distinction and adjust time zones to align session times with their local time. By showing session-specific market behavior—calmer Asian sessions versus volatile London sessions—the indicator supports tailored trading strategies and improved timing of trades. It enhances analysis by allowing users to observe price action across different sessions and anticipate volatility spikes during session openings, closings, and overlaps. This tool is applicable across multiple markets including forex, cryptocurrencies (e.g., BTCUSD, ETH), indices (e.g., NAS100), and commodities (e.g., XAUUSD). The indicator facilitates informed decision-making based on session dynamics, helping traders optimize entry and exit points according to time-specific market activity.
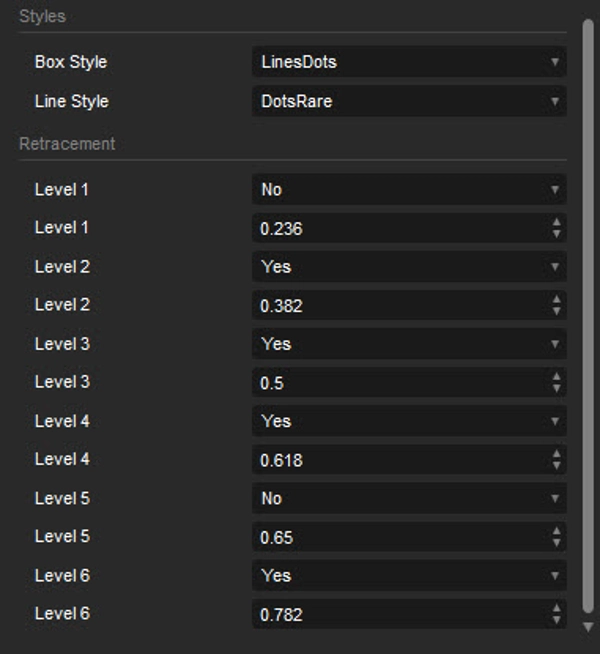
指标配置
客户评价
4.3
评价:3
5 | 33 % | |
4 | 67 % | |
3 | 0 % | |
2 | 0 % | |
1 | 0 % |
客户评价
April 26, 2026
Can you check the indicator code. Unable to edit timeline. As new york and london times vary.
December 10, 2025
Market Sessions Pre highlights Asian, London and NY sessions with clear visual blocks. Perfect for intraday timing and volatility awareness. Lightweight, stable and clean. Great with SMC/ICT concepts. Would benefit from alerts and killzone markers, but already a highly useful tool.
讨论
常见问答
BTCUSD
Forex
Signal
Scalping
EURUSD
Crypto
XAUUSD
NAS100
cTrader Store 提供的所有产品,包括交易机器人、指标和插件,均由第三方开发者提供,仅供信息参考和技术访问之用。cTrader Store 并非经纪商,不提供投资建议、个人推荐或任何未来业绩保证。
该作者的其他作品


价格
38
销售
2.37K
免费安装