
说明
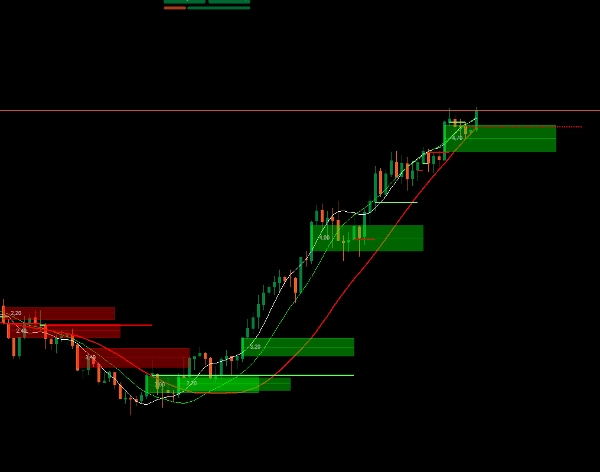
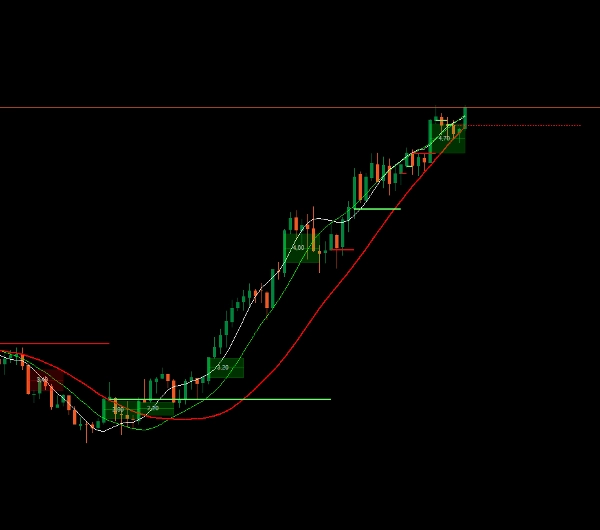
一个简单而有效的工具,标示买入和卖出的切入点。它结合了FVG(公平价值缺口),并能过滤必要的点数以进行可靠的分析。该指标依赖于MACD计算、随机振荡器、RSI或商品通道指数。
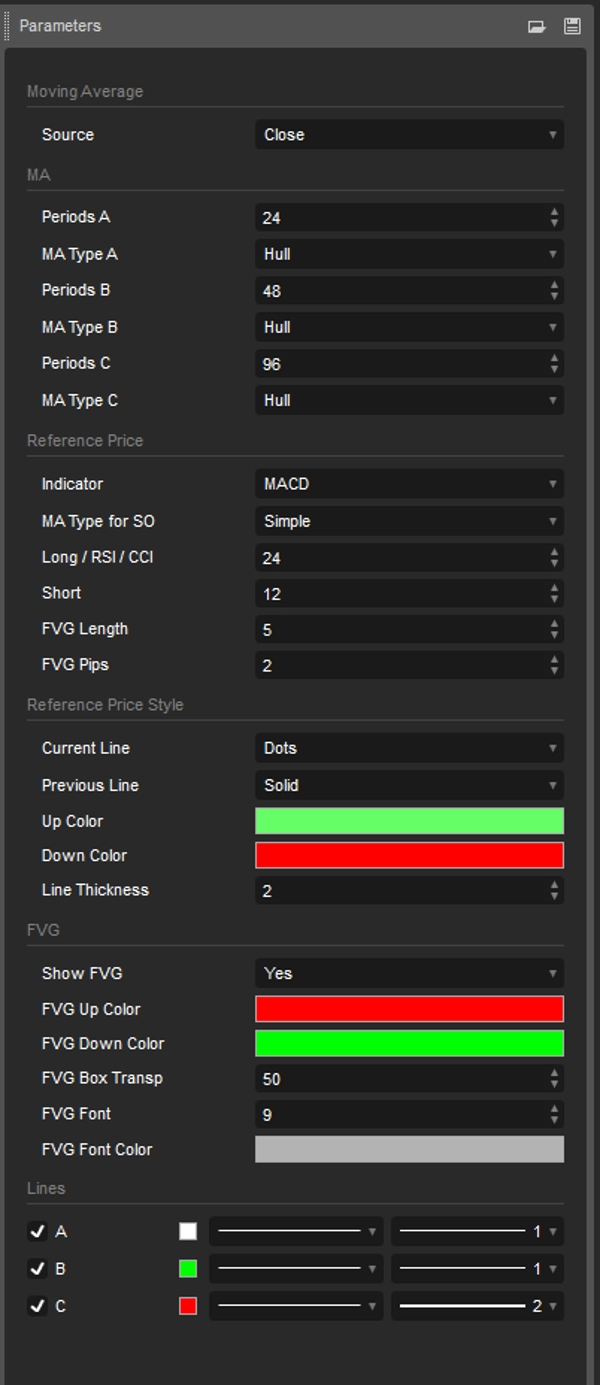
在描述中,我指出了重要参数;其余的是样式配置,如颜色、线型和字体大小。
指标
选择用于切入点计算的指标类型的选项
SO的移动平均类型
随机振荡器的移动平均类型
长/RSI/CCI
所有指标的周期
短期
用于MACD和随机振荡器指标
FVG长度
通过此参数可以延长FVG的显示长度
FVG点数
通过此参数可以过滤FVG的点数
配合以下附加工具
OrderPrice V3 https://ctrader.com/products/397
NTMPICLL https://ctrader.com/products/327
Range Box Level https://ctrader.com/products/245
或 RangeBoxFibonacci https://ctrader.com/products/526
市场时段 https://ctrader.com/products/525?u=Thomas-Sparrow
MacdVolume https://ctrader.com/products/267
4MA https://ctrader.com/products/247
祝你好运 😀
摘要
指标配置
客户评价
4.5
评价:2
5 | 50 % | |
4 | 50 % | |
3 | 0 % | |
2 | 0 % | |
1 | 0 % |
客户评价
August 28, 2025
Clear order visualization, customizable, lightweight. User-friendly, wallet-friendly and resourceful — give it a go
January 29, 2025
讨论
常见问答
Indices
Commodities
RSI
MACD
cTrader Store 提供的所有产品,包括交易机器人、指标和插件,均由第三方开发者提供,仅供信息参考和技术访问之用。cTrader Store 并非经纪商,不提供投资建议、个人推荐或任何未来业绩保证。
该作者的其他作品


猜您喜欢


价格
147
销售
11.17K
免费安装