
الوصف
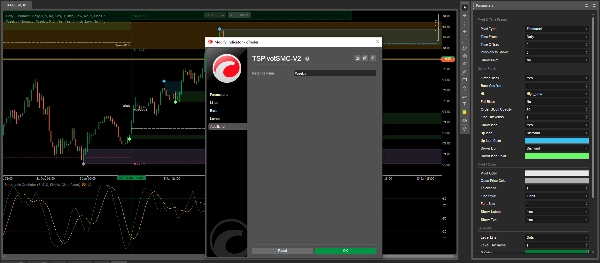
TSPivotSMC-V2: دمج نقاط الارتكاز الكلاسيكية والسيولة المؤسسية
TSPivotSMC-V2 ليس مجرد مؤشر نقاط ارتكاز آخر؛ إنه خريطة متقدمة مفاهيم المال الذكي (SMC) مصممة للمتداولين الذين يسعون للدقة المؤسسية. لقد حولنا أكثر أدوات التحليل الفني الكلاسيكي موثوقية إلى محرك كشف السيولة ومناطق احتمالية عالية.
الميزات الرئيسية:
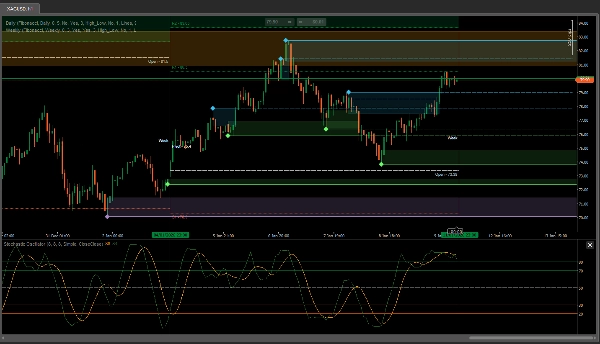
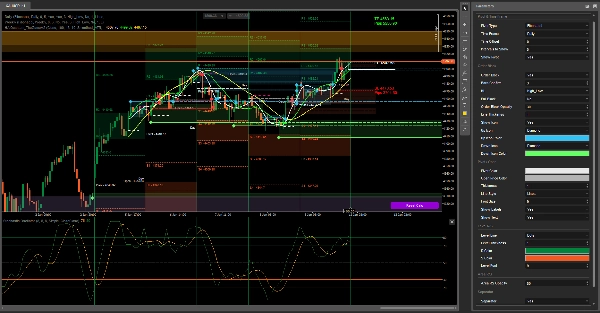
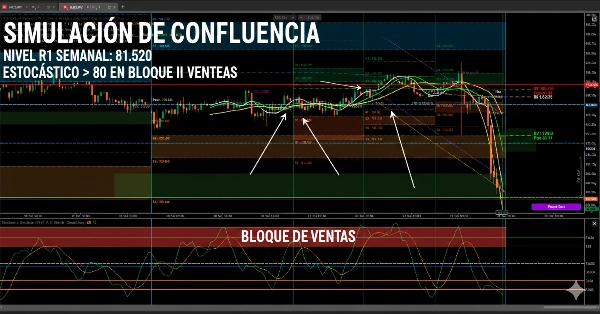
• كتل أوامر الجلسة التلقائية: يحدد ويرسم مستطيلات عند مستويات الأعلى والأدنى للجلسة السابقة، معلمًا مناطق العرض والطلب الحرجة.
• إدارة التخفيف الذكية: يكتشف المؤشر متى تم كسر الكتلة بالسعر، محولًا المستطيل الصلب إلى خط مرجعي متقطع. هذا يسمح لك بالحفاظ على مخطط نظيف مع الاحتفاظ بالاختراقات التاريخية.
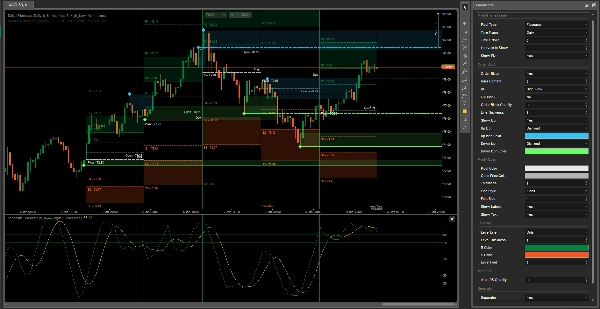
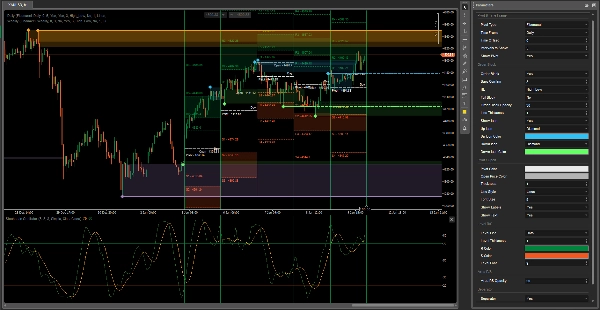
• التسلسل الهرمي متعدد الأطر الزمنية (MTF): مصمم للعمل على طبقات. يمكنك تطبيق نسخة يومية للدخول الدقيق ونسخة أسبوعية لتحديد ميل السوق، مما يتيح لك رؤية التلاقيات ذات التأثير العالي.
• التأكيد الاحترافي: يتضمن فلتر تأكيد الشمعدان (Bars Confirm) لضمان أن مناطق السيولة صالحة وليست مجرد ضوضاء سوقية.
• تخصيص جمالي كامل: قم بتكوين الألوان، والشفافية، وأنماط الخطوط بشكل مستقل لكل إطار زمني، مما يسهل قراءة السعر بسرعة تحت الضغط.
لماذا تختار TSPivotSMC؟
بينما تعطيك نقاط الارتكاز التقليدية أرقامًا فقط، يقدم لك TSPivotSMC-V2 سرد السوق. من خلال دمج مستويات فيبوناتشي/القياسية الرياضية مع حركة السعر المؤسسية، يمكنك رؤية مكان وجود المال ومتى تم تخفيفه، مما يمنحك ميزة تنافسية فريدة على cTrader.
ملاحظة لمستخدمي المتجر: "يوصى باستخدام نسختين من المؤشر (يومية وأسبوعية) لتعظيم فعالية تحليل السيولة على الأطر الزمنية الأعلى."
الملخص
Designed for multi-timeframe analysis, TSPivotSMC-V2 supports layering daily and weekly instances to refine entry points and define overall market bias. It includes a candlestick confirmation filter to validate liquidity zones and reduce noise. Users can customize colors, opacities, and line styles independently for each timeframe to enhance visual clarity under trading pressure.
By combining mathematical pivot levels with institutional price action, this tool provides a detailed market narrative, helping traders identify where liquidity resides and when it has been mitigated. It is applicable across multiple markets including Forex, indices, commodities, cryptocurrencies, and stocks. Using multiple timeframe instances is recommended to maximize liquidity analysis effectiveness.
تقييمات العملاء
5 | 100 % | |
4 | 0 % | |
3 | 0 % | |
2 | 0 % | |
1 | 0 % |


![شعار "Smart Money Concepts (SMC) [Iridio Capital]"](https://cdn.ctrader.com/image/webp/28b69fd1-ef54-4bed-9487-07e78e883be4_40934)
