

Money Flow Profile
مؤشر
الإصدار 1.0، Jul 2026
Windows, Mac

534.4M
حجم التداول
9.76M
الربح بالبيب
4
المبيعات
الوصف
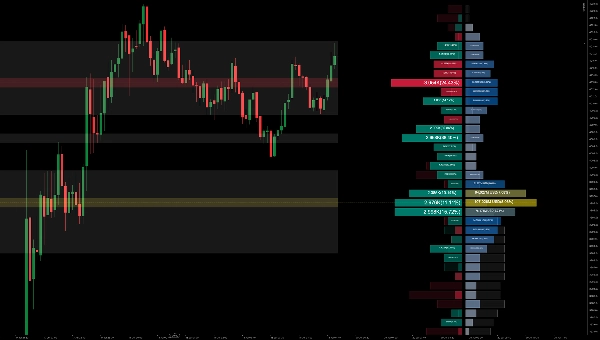
📊 ملف تدفق الأموال
ملف تدفق الأموال هو أداة رسم بياني متقدمة تقيس حجم التداول أو تدفق الأموال عند جميع مستويات الأسعار في السوق خلال فترة زمنية محددة. يبرز العلاقة بين سعر الأصل ورغبة المتداولين في الشراء أو البيع، مما يتيح لك:
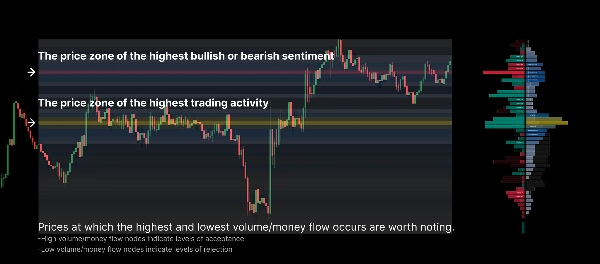
- كشف مستويات السعر الرئيسية: تحديد مجموعات الحجم وعقد السيولة العالية بسهولة مثل نقطة التحكم (POC).
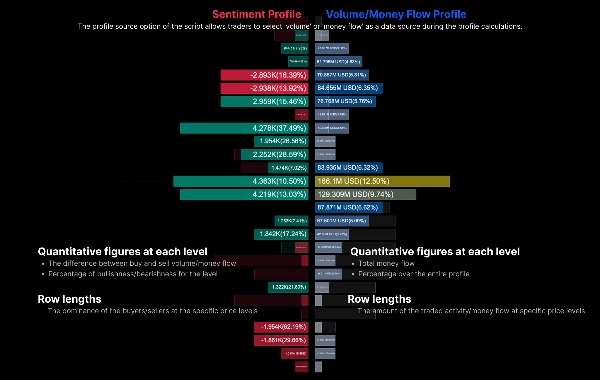
- تحليل معنويات السوق: من خلال عرض ملف المعنويات على اليسار وملف الحجم على اليمين، يحدد ما إذا كان المشترون أو البائعون يهيمنون عند كل مستوى سعر محدد.
- المقارنة عبر الفترات: مقارنة الملف الحالي مباشرة مع ملف الفترة السابقة الشبح لملاحظة التحولات في مركز ثقل السوق.
⚙️ المعلمات الأساسية ودليل الاستخدام
1. الإعدادات العامة
- طول النظر للخلف / النطاق الثابت: يحدد عدد الأعمدة التاريخية المستخدمة لحساب الملف (مثلاً، آخر 200 عمود).
- مصدر البيانات:
-
1 = الحجم: يحسب الملف بناءً على حجم التداول التقليدي.2 = تدفق الأموال: يدمج عمق السعر لحساب توزيع تدفق الأموال.
2. إعدادات الملف
- دقة الصف (الصفوف): يحدد دقة المحور العمودي. عدد أعلى (مثلاً، 50-100) ينتج ملفًا أكثر تفصيلاً.
- عرض الملف والإزاحة الأفقية: يضبط مدى عرض الملف (كنسبة مئوية) ومدى إزاحته إلى اليمين، لمنع تداخله مع الشمعة الحالية.
3. المعنويات والعرض
- استقطاب المعنويات:
-
1 = الشمعة: يحدد المعنويات الصعودية/الهبوطية بناءً فقط على فتح وإغلاق الشمعة (الاستقطاب).2 = ضغط الشراء/البيع: يستخدم حسابًا أكثر دقة يأخذ في الاعتبار الفتائل والإغلاق بالنسبة للأعلى/الأدنى.
- عرض ملف المعنويات / ملف الحجم: مفاتيح مستقلة لعرض ملف المعنويات الصافي (يسار) وملف الحجم الرئيسي (يمين).
- عرض الفترة السابقة: عند التفعيل، يرسم ملف "الشبح" الخلفي الذي يمثل نفس نافذة الوقت من الفترة السابقة. مفيد لتتبع تحولات الدعم/المقاومة.
4. عرض المنطقة الموسعة
- عرض خريطة الحرارة: يعرض كثافة الملف عبر كامل فترة الحساب كخريطة حرارة خلفية. يمكنك اختيار عرض "الحجم" أو "المعنويات".
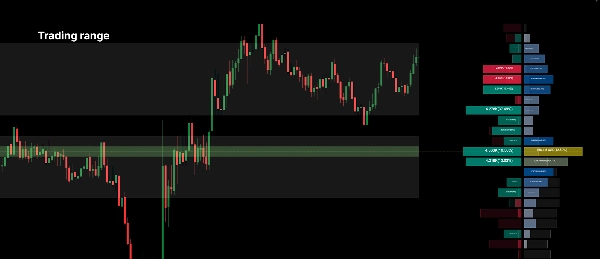
- عرض منطقة القيمة: يبرز نطاق السعر الأساسي حيث حدثت غالبية حجم التداول. العتبة قابلة للتخصيص (مثلاً، 70%).
- عرض منطقة نقطة التحكم (POC): يرسم تلقائيًا خطًا أفقيًا ومنطقة عند نقطة التحكم (مستوى السعر بأعلى حجم) للنطاق المحدد.
💡 نصائح تداول عملية:
- ابحث عن عقد الحجم العالي (القمم) لتعمل كمستويات دعم أو مقاومة قوية.
- ابحث عن عقد الحجم المنخفض (الوديان)، حيث يميل السعر إلى التحرك بسرعة عبر هذه المناطق ذات السيولة المنخفضة.
- استخدم ملف الشبح للفترة السابقة: إذا كانت نقطة التحكم الحالية (الخط الأصفر) تتشكل أعلى من نقطة التحكم للفترة السابقة، فهذا يشير إلى أن توافق القيمة يتحرك صعودًا، وهو إشارة صعودية عامة.
الملخص
AI summary
Money Flow Profile is an advanced indicator that maps traded volume and market sentiment across price levels over a specified time period. It visualizes the relationship between price and trader activity, highlighting key liquidity zones such as volume clusters and the Point of Control (POC). The tool displays a Sentiment Profile on the left and a Volume Profile on the right, enabling users to assess whether buyers or sellers dominate at each price level. It supports direct comparison with the previous period’s profile via a ghost overlay to track shifts in market value consensus.
Core configurable parameters include lookback length, data source selection (volume or money flow), row resolution for vertical granularity, profile width and offset, and sentiment polarity calculation methods (candle-based or buy/sell pressure). Display options allow toggling of sentiment and volume profiles, previous period overlays, heatmaps of volume or sentiment density, value area highlighting, and automatic POC zone marking.
The indicator is designed to help identify strong support and resistance levels at high volume nodes and anticipate rapid price movements through low volume nodes. It supports detailed volume and sentiment analysis to inform trading decisions based on liquidity and market structure.
Core configurable parameters include lookback length, data source selection (volume or money flow), row resolution for vertical granularity, profile width and offset, and sentiment polarity calculation methods (candle-based or buy/sell pressure). Display options allow toggling of sentiment and volume profiles, previous period overlays, heatmaps of volume or sentiment density, value area highlighting, and automatic POC zone marking.
The indicator is designed to help identify strong support and resistance levels at high volume nodes and anticipate rapid price movements through low volume nodes. It supports detailed volume and sentiment analysis to inform trading decisions based on liquidity and market structure.
ملف تعريف المؤشر
فئة المؤشر
الحجم
نوع المخرجات
التصور
متطلبات البيانات
الحجم
DoM
أعمدة السعر فقط
بيانات التيك
الإشارات المدعومة
الانقطاع
قوة الاتجاه
الانعكاس
التقلب
لمس المستوى
كسر المستوى
تقييمات العملاء
0.0
التقييمات: 0
تقييمات العملاء
لا توجد تقييمات لهذا المنتج حتى الآن. هل جرَّبته بالفعل؟ كن أول من يخبر الآخرين!
مناقشة
الأسئلة الشائعة
Key Levels
Volume
يتم توفير المنتجات المتاحة من خلال cTrader Store، بما في ذلك روبوتات التداول والمؤشرات والإضافات، من قبل مطوري الطرف الثالث وإتاحتها لأغراض الوصول المعلوماتي والفني فقط. cTrader Store ليس وسيطًا ولا يقدم نصائح استثمارية أو توصيات شخصية أو أي ضمان للأداء المستقبلي.
المزيد من هذا المؤلف
















![شعار "Wyckoff Toolkit [Iridio Capital]"](https://cdn.ctrader.com/image/webp/5318c788-91ef-4297-bca6-4ce73b1516a8_61556)




السعر
534.4M
حجم التداول
9.76M
الربح بالبيب
4
المبيعات