

OrderFlow Absorption Matrix
مؤشر
1 عمليات الشراء
الإصدار 1.0، Jul 2026
Windows, Mac
منذ 23/06/2025
1
المبيعات
الوصف
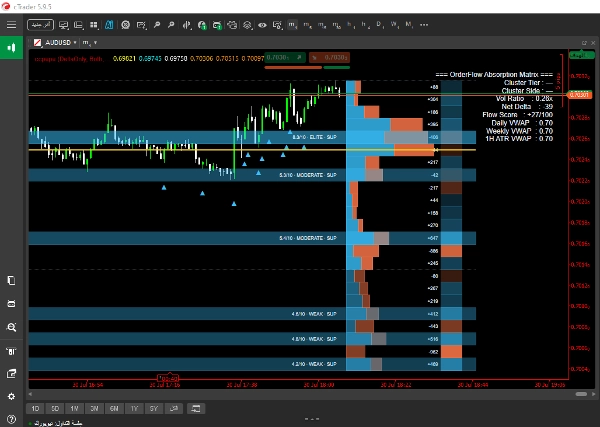
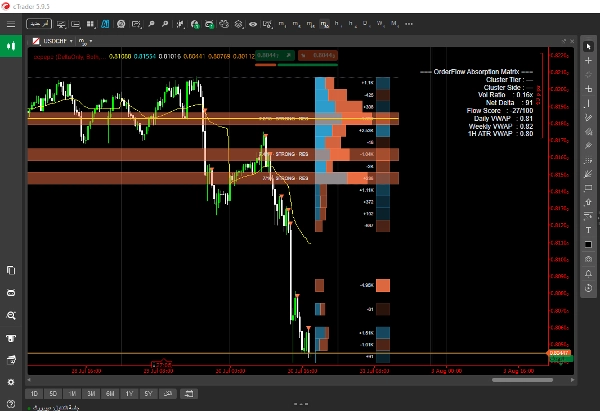
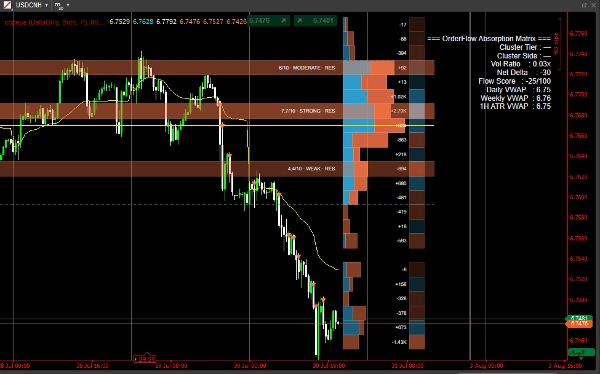
1️⃣ تدفق الطلب واكتشاف دلتا
- التنقيب في الإطار الزمني الأدنى (LTF): يقوم المؤشر بفحص بيانات الشموع للإطار الزمني الأدنى (مثل أشرطة الدقيقة الواحدة) داخل كل شريط حالي لحساب:
-
- دلتا صافية: الفرق الصافي بين حجم الشراء والبيع.
- الامتصاص: حجم كبير تم تداوله عند أطراف الشريط يفشل في دفع السعر أبعد، مما يشير إلى أوامر حد سلبية كبيرة تمتص سيولة السوق.
- اكتشاف طباعة الحيتان: يستخدم النسب المئوية الديناميكية المحسوبة عبر ثلاث نوافذ نظر مميزة (قصيرة، متوسطة، طويلة) مع دمج محرك الإجماع القابل للتخصيص لعزل ارتفاعات حجم المؤسسات الحقيقية.
2️⃣ محرك ملف الحجم التكيفي
- تقسيم الصناديق: يقسم نطاق السعر التاريخي (أشرطة النظر للخلف) إلى صناديق سعرية رأسية متساوية.
- توزيع الحجم: يفصل حجم الشراء، حجم البيع، والدلتا لكل صندوق، مع عرض أشرطة ملف أفقية نسبية على الجانب الأيمن من الرسم البياني.
- معالجة الإطار الزمني الديناميكي: بدلاً من الاعتماد على نبضات ثابتة بالثواني، يقوم المؤشر بتقييم امتدادات الأشرطة الحقيقية ديناميكيًا (
GetCurrentBarSpan). هذا يمنع انهيار الملف أو تشويه الخط عبر الأطر الزمنية غير القياسية وفواصل جلسات السوق (مثل فجوات السوق الليلية). - حساب منطقة القيمة ونقطة التحكم (POC):
-
- نقطة التحكم (POC): يحدد مستوى السعر الأعلى حجمًا ويسلط الضوء عليه بخط مرساة بارز.
- منطقة القيمة (VA): يعزل ديناميكيًا نسبة الحجم الأساسية (مثلاً 70%) ويرسم أعلى منطقة قيمة (VAH) وأدنى منطقة قيمة (VAL).
3️⃣ نظام تقييم المناطق متعدد العوامل المرجح
يتم تقييم كل صندوق سعري باستمرار باستخدام صيغة متعددة العوامل المرجحة مع نقاط من 1 إلى 10:
Score=w1⋅Volume+w2⋅Absorption+w3⋅Touches+w4⋅Rejections+w5⋅Recency
- توصيف المناطق الآلي: المستويات ذات الدرجات العالية (النخبة أو القوية) تُسقط على الرسم البياني كمناطق دعم/مقاومة ديناميكية مع شارات قوة رقمية في الوقت الحقيقي.
4️⃣ إشارات VWAP المثبتة ومحفزات التنفيذ
- يحسب خطوط مرجعية VWAP مثبتة على تحولات زمنية رئيسية (بداية اليوم، الأسبوع، والشهر).
- يحلل تقاطع حركة السعر نسبة إلى VWAP المثبتة جنبًا إلى جنب مع محفزات التجمع ذات الحجم الكبير لرسم سهام دخول دقيقة مباشرة على الرسم البياني.
5️⃣ لوحة تحليلات على الشاشة
واجهة نظيفة وواقعية في الوقت الحقيقي موضوعة في أي زاوية من اختيارك توفر ملخصًا فوريًا لحالة السوق:
- درجة التجمع: تصنيف الشريط الحالي (حوت، متوسط، صغير).
- جانب التجمع والدلتا الصافية: انحياز السيولة الاتجاهي وأرقام الدلتا الدقيقة.
- نسبة الحجم: الحجم الحالي نسبة إلى المتوسطات المتحركة.
- درجة التدفق: درجة زخم/تدفق الطلبات معادلة تتراوح من −100 إلى +100.
- معايير VWAP: قيم الوقت الحقيقي لمستويات VWAP النشطة
الملخص
ملخص الذكاء الاصطناعي
OrderFlow Absorption Matrix is an advanced indicator for cTrader that provides detailed order flow and volume profiling to identify institutional trading activity. It analyzes lower timeframe candle data to calculate net delta (buy vs. sell volume) and absorption, highlighting heavy volume at bar extremes where price fails to move further, indicating large passive limit orders. The indicator detects significant volume spikes ("Whale Prints") using dynamic percentiles across multiple lookback windows combined with a consensus engine.
It features an adaptive volume profile engine that segments historical price ranges into equal bins, displaying buy volume, sell volume, and delta per bin with proportional horizontal bars. The profile dynamically adjusts for varying timeframes and market session breaks, calculating key levels such as Point of Control (highest volume price) and Value Area (core volume range).
A weighted multi-factor scoring system continuously evaluates price bins based on volume, absorption, touches, rejections, and recency, projecting high-scoring zones as dynamic support/resistance levels with numeric strength indicators. Anchored VWAP lines are calculated for key time anchors (day, week, month) and combined with volume cluster triggers to plot precise entry signals.
An on-screen analytics dashboard provides real-time summaries including cluster tier classification, directional delta, volume ratios, momentum scores, and VWAP benchmarks, aiding in market condition assessment and trade decision-making.
It features an adaptive volume profile engine that segments historical price ranges into equal bins, displaying buy volume, sell volume, and delta per bin with proportional horizontal bars. The profile dynamically adjusts for varying timeframes and market session breaks, calculating key levels such as Point of Control (highest volume price) and Value Area (core volume range).
A weighted multi-factor scoring system continuously evaluates price bins based on volume, absorption, touches, rejections, and recency, projecting high-scoring zones as dynamic support/resistance levels with numeric strength indicators. Anchored VWAP lines are calculated for key time anchors (day, week, month) and combined with volume cluster triggers to plot precise entry signals.
An on-screen analytics dashboard provides real-time summaries including cluster tier classification, directional delta, volume ratios, momentum scores, and VWAP benchmarks, aiding in market condition assessment and trade decision-making.
ملف تعريف المؤشر
فئة المؤشر
الإحصاءات
نوع المخرجات
فلتر
متطلبات البيانات
بيانات التيك
الإشارات المدعومة
كسر المستوى
لمس المستوى
الانعكاس
التباين
مناقشة
تقييمات العملاء
0.0
التقييمات: 0
تقييمات العملاء
لا توجد تقييمات لهذا المنتج حتى الآن. هل جرَّبته بالفعل؟ كن أول من يخبر الآخرين!
الأسئلة الشائعة
Bollinger Bands
Key Levels
Volume
Supply & Demand
VWAP
Support & Resistance
يتم توفير المنتجات المتاحة من خلال cTrader Store، بما في ذلك روبوتات التداول والمؤشرات والإضافات، من قبل مطوري الطرف الثالث وإتاحتها لأغراض الوصول المعلوماتي والفني فقط. cTrader Store ليس وسيطًا ولا يقدم نصائح استثمارية أو توصيات شخصية أو أي ضمان للأداء المستقبلي.
المزيد من هذا المؤلف

















السعر
منذ 23/06/2025
1
المبيعات