
MACDVolume
مؤشر
19 عمليات الشراء
الإصدار 1.0، Dec 2024
Windows, Mac
5.0
التقييمات: 3

الوصف
مؤشر MACD المتقدم مع تغيير اللون الديناميكي والحجم
الوصف: مؤشر MACD المتقدم لدينا ليس مجرد مخطط بياني بسيط. تم تصميم هذا المؤشر لتوفير رؤية واضحة وديناميكية لاتجاهات السوق، مع ميزات فريدة تجعله لا غنى عنه لأي متداول جاد.
الميزات الرئيسية:
- تغيير اللون الديناميكي:
-
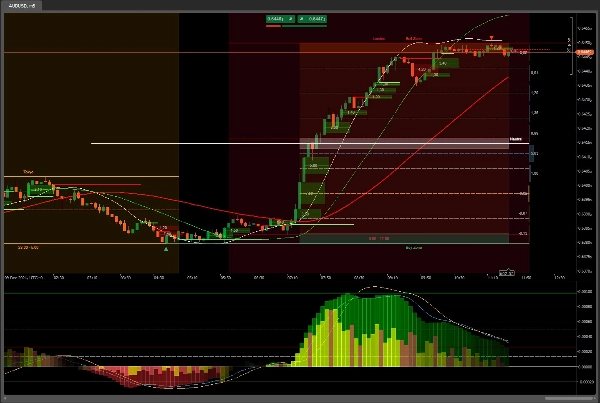
- إيجابي: يتغير المخطط البياني من الأخضر إلى الأبيض مع زيادة القيم، مما يوفر تصورًا واضحًا لاتجاهات الصعود.
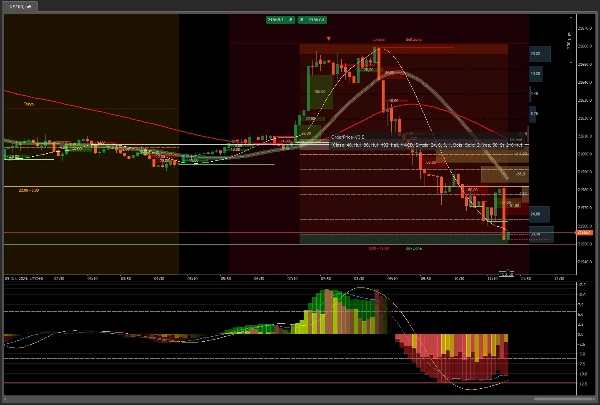
- سلبي: يتغير المخطط البياني من الأحمر إلى الأبيض مع انخفاض القيم، مما يبرز اتجاهات الهبوط.
- مؤشر الحجم:
-
- حجم إيجابي: ممثل بأشرطة خضراء، تشير إلى زيادة في حجم التداول.
- حجم سلبي: ممثل بأشرطة حمراء، تشير إلى انخفاض في حجم التداول.
- تصور واضح: يجمع بين ألوان أشرطة الحجم (الأخضر، الأصفر، البني، الأحمر) لتوفير رؤية واضحة لنشاط الشراء والبيع في السوق.
- تكبير تلقائي:
-
- يحافظ على المؤشر في المركز ويتم ضبطه تلقائيًا للعرض الأمثل، دون الحاجة إلى تعديلات يدوية مستمرة.
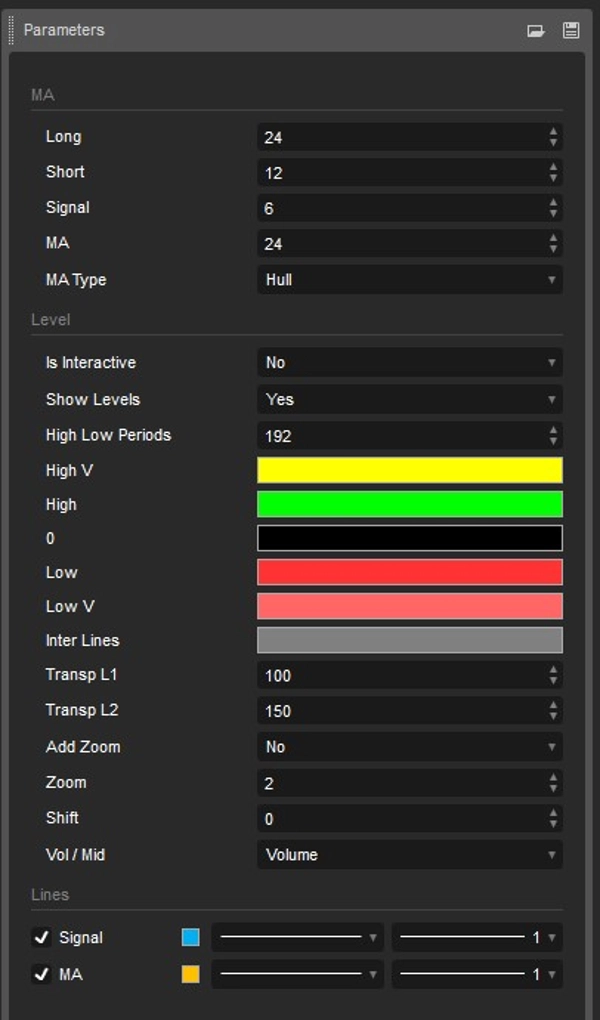
- المتوسط المتحرك القابل للتخصيص:
-
- يتضمن متوسطًا متحركًا إضافيًا يمكنك اختياره من الخيارات المتاحة، مما يسمح بتخصيص أكبر وتكيف مع استراتيجيتك التداولية.
- الارتفاعات والانخفاضات:
-
- يعرض أعلى وأدنى المستويات في الفترة المختارة، مما يوفر رؤية واضحة لحدود السوق.
الفوائد:
- وضوح بصري: التغييرات الديناميكية في اللون تجعل من السهل تحديد الاتجاهات ونقاط التحول في السوق.
- التخصيص: القدرة على اختيار متوسطات متحركة مختلفة وضبط مستويات اللون تتيح لك تكييف المؤشر مع احتياجاتك الخاصة.
- الكفاءة: التكبير التلقائي يضمن لك دائمًا أفضل عرض للمؤشر دون الحاجة إلى تعديلات يدوية.
- تحليل شامل: يشمل الحجم ومستويات الارتفاع/الانخفاض لتوفير رؤية أكثر اكتمالاً للسوق.
مثالي لـ:
- المتداولين الذين يبحثون عن أداة متقدمة وقابلة للتخصيص لتعزيز تحليلاتهم الفنية.
- أولئك الذين يريدون تصورًا واضحًا وديناميكيًا لاتجاهات السوق.
- المستخدمين الذين يقدرون الكفاءة والتخصيص في أدوات التداول الخاصة بهم.
مع أدوات إضافية مثل
OrderPrice V3 https://ctrader.com/products/397
NTMPICLL https://ctrader.com/products/327
Range Box Level https://ctrader.com/products/245
Or RangeBoxFibonacci https://ctrader.com/products/526
Market Session https://ctrader.com/products/525
MacdVolume https://ctrader.com/products/267
4MA https://ctrader.com/products/247
ستكون لا تقهر
حظًا سعيدًا 😀
الملخص
ملخص الذكاء الاصطناعي
The MACDVolume indicator is an advanced technical analysis tool combining the Moving Average Convergence Divergence (MACD) histogram with volume data for enhanced market trend visualization. It features dynamic color changes in the MACD histogram: bullish trends are shown by a gradient from green to white, while bearish trends shift from red to white. The volume component uses color-coded bars—green for increasing volume and red for decreasing volume—with additional colors (yellow, brown) to clearly depict buying and selling activity.
Key functionalities include auto zoom, which keeps the indicator centered and optimally scaled without manual adjustment, and a customizable moving average that can be selected from available options to fit different trading strategies. The indicator also displays the highest and lowest price levels within the selected period, providing insight into market extremes.
Designed for traders seeking a customizable and efficient tool, MACDVolume offers clear visual cues for trend identification and comprehensive market analysis by integrating volume and price extremes. It supports markets such as Forex and Stocks and is suitable for users who prioritize clarity, customization, and efficiency in their technical indicators.
ملف تعريف المؤشر
تقييمات العملاء
5.0
التقييمات: 3
5 | 100 % | |
4 | 0 % | |
3 | 0 % | |
2 | 0 % | |
1 | 0 % |
تقييمات العملاء
January 12, 2026
August 28, 2025
MACDVolume is a strong complementary tool for traders already using MACD. It enhances decision-making by incorporating volume, making signals more trustworthy.
April 17, 2025
مناقشة
الأسئلة الشائعة
Forex
Stocks
MACD
يتم توفير المنتجات المتاحة من خلال cTrader Store، بما في ذلك روبوتات التداول والمؤشرات والإضافات، من قبل مطوري الطرف الثالث وإتاحتها لأغراض الوصول المعلوماتي والفني فقط. cTrader Store ليس وسيطًا ولا يقدم نصائح استثمارية أو توصيات شخصية أو أي ضمان للأداء المستقبلي.


السعر
147
المبيعات
11.17K
التثبيتات المجانية