
説明
cTraderプラットフォーム専用に設計された包括的な相対通貨強度(RCS)インジケーターで、外国為替市場のダイナミクスをより深く理解しましょう。
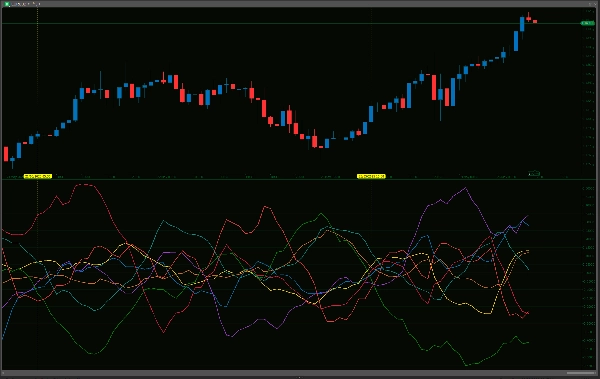
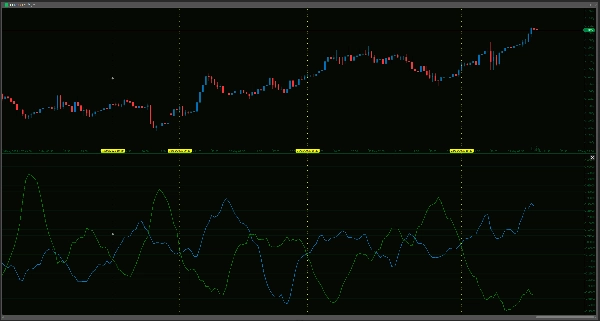
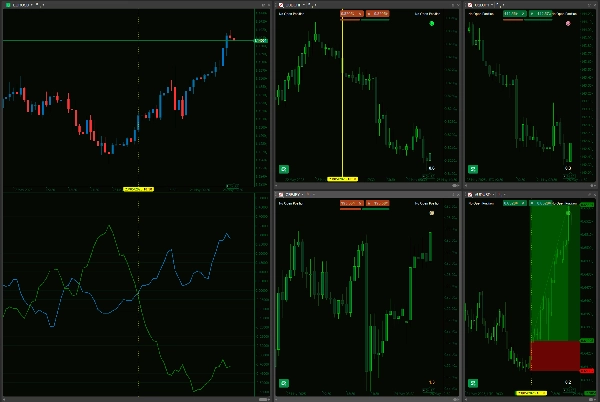
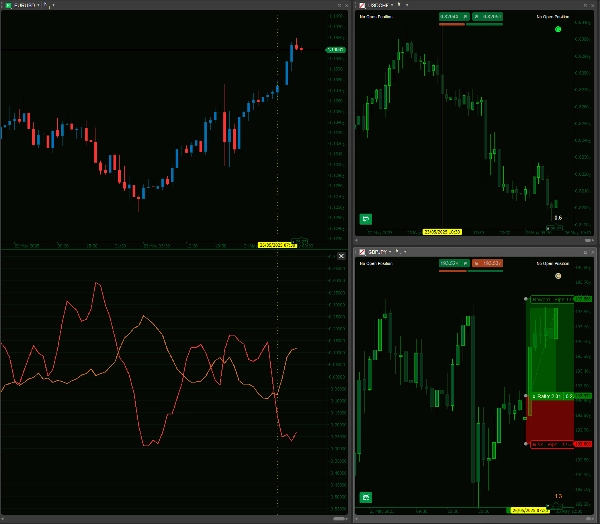
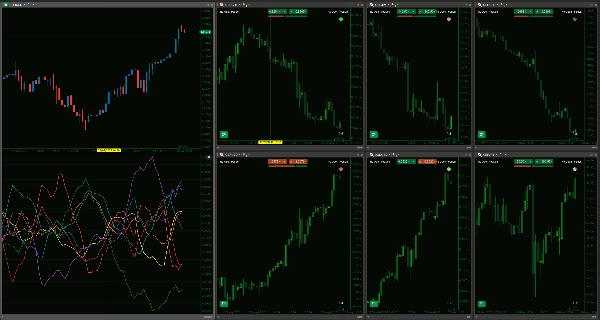
この強力なツールは、28の通貨ペアのバスケットにわたって互いに対するパーセンテージ変化を分析することで、AUD、USD、EUR、JPY、GBP、CAD、CHF、NZDの8つの主要通貨の個別パフォーマンスを綿密に評価します。ユーザー定義のルックバック期間と平滑化期間により、迅速なスキャルピングから長期戦略まで、独自の取引アプローチに合わせてインジケーターの感度を微調整できます。明確な視覚的出力により、一目で比較が可能で、強い上昇モメンタムを示す通貨や弱さの兆候を示す通貨を迅速に特定でき、戦略により高い潜在力を持つ通貨ペアの選択に役立ちます。単一ペア分析を超えて、市場の動きを真に牽引している個別通貨の全体像を見る方法を提供します。
しかし、このインジケーターを使用する際は、その能力と限界を明確に理解することが重要です。RCSインジケーターは高度な分析ツールであり、絶対的な予測装置や完全な「セット&フォーゲット」取引システムではありません。その計算は過去の価格データに基づいており、確立された取引手法を補完することを目的としており、常に徹底した価格アクション分析、ファンダメンタル要因の考慮、および堅牢なリスク管理を含むべきです。ラインで示される「強さ」や「弱さ」は、市場全体の文脈内で慎重に解釈する必要があります。例えば、極端な「強さ」を示す通貨は、買われ過ぎの状態や重要な抵抗レベルに近づいている可能性があります。
インジケーターのパフォーマンスは、現在の市場状況(例えば、強いトレンド市場と横ばいの乱高下市場で異なる動作をする場合があります)によっても変動し、精度は関与する28通貨ペアすべての十分でクリーンな過去データがプラットフォームにあることに依存します。包括的なクロスカレンシー分析のための初期データ読み込みは、特に接続が遅い場合やハードウェアが非力な場合、プラットフォームのリソースに負担をかけることがあります。多通貨の視点を提供することで、このRCSインジケーターは、競争の激しい外国為替市場でより情報に基づいた戦略的に健全な取引判断を支援し、エッジを高めるための貴重な補助ツールとして提供されており、単独の解決策としてではありません。
このインジケーターが機能するために、ブローカーがすべてのクロスペアを提供していることを確認してください。
--------------------------
他のインジケーターもぜひご覧ください!
https://ctrader.com/products/1181
https://ctrader.com/products/1182
https://ctrader.com/products/1180
https://ctrader.com/products/1015
https://ctrader.com/products/555
https://ctrader.com/products/553
https://ctrader.com/products/554
https://ctrader.com/products/552
https://ctrader.com/products/557
https://ctrader.com/products/845
https://ctrader.com/products/848
https://ctrader.com/products/847
https://ctrader.com/products/846
https://ctrader.com/products/551
https://ctrader.com/products/574
https://ctrader.com/products/573
https://ctrader.com/products/556
https://ctrader.com/products/558
https://ctrader.com/products/559
https://ctrader.com/products/560
概要
The indicator provides a clear visual representation of currency strength and weakness, enabling traders to identify currencies with strong momentum or signs of weakness at a glance. This multi-currency perspective helps move beyond single-pair analysis to understand which currencies are driving market movements.
The tool relies on historical price data and requires all relevant currency pairs to be available from the broker. Its performance may vary with market conditions, and it is intended to complement, not replace, comprehensive trading strategies that include price action, fundamental analysis, and risk management. Initial data loading can be resource-intensive due to the breadth of cross-currency calculations.
This indicator serves as an analytical aid to support more informed Forex trading decisions by highlighting relative currency strength across major pairs.
カスタマーレビュー
5 | 33 % | |
4 | 67 % | |
3 | 0 % | |
2 | 0 % | |
1 | 0 % |


![「High-Low Divergence [Iridio Capital]」ロゴ](https://cdn.ctrader.com/image/webp/443c4661-7abb-40f1-842f-4b6ec560649b_40914)
