
الوصف
عادةً ما تسمح مؤشرات الدعم والمقاومة متعددة الأطر الزمنية للمتداولين برؤية هذه المستويات عبر أطر زمنية مختلفة، مثل الرسوم البيانية الساعية واليومية والأسبوعية أو الشهرية. من خلال دمج أطر زمنية متعددة، يمكن للمتداولين الحصول على منظور أوسع حول مكان وجود مستويات السعر الرئيسية وكيف يمكن أن تؤثر على حركة السعر.
يمكن لهذا النوع من المؤشرات مساعدة المتداولين على اتخاذ قرارات تداول أكثر وعيًا من خلال تحديد مستويات الدعم والمقاومة المهمة التي قد تؤثر على تحركات السعر عبر أطر زمنية مختلفة. كما يمكن أن يساعد المتداولين على توقع الانعكاسات المحتملة أو فرص الاختراق عندما يقترب السعر من هذه المستويات عبر أطر زمنية متعددة.
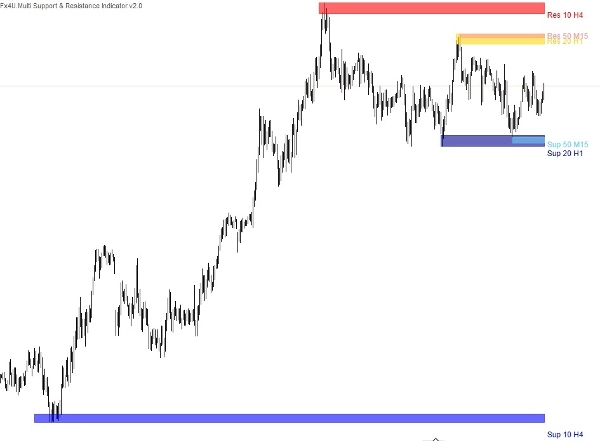
هناك ثلاثة أنواع من مستويات الدعم والمقاومة:
تم بناء مؤشرات الدعم والمقاومة الثلاثة ضمن هذا المؤشر الواحد مما يتيح لك رسم مناطق العرض والطلب على الرسم البياني باستخدام الإعدادات التالية.
- قيمة الفترة.
- الإطار الزمني.
- عدد القمم والقيعان – هذا هو عدد نقاط الدعم/المقاومة الحالية + السابقة المعروضة. على سبيل المثال، إذا اخترنا 2، سيختار المؤشر نقطة دعم ومقاومة أخرى في الماضي.
- اسم ولون المؤشر.
تميل مستويات الدعم والمقاومة المهمة على الأطر الزمنية الأعلى إلى أن تكون أكثر أهمية، ومن خلال استخدام مؤشر متعدد الأطر الزمنية، يمكن للمتداولين تأكيد أهمية المستوى إذا ظهر باستمرار عبر أطر زمنية متعددة. تزيد هذه التأكيدات من موثوقية المستوى وتعزز ثقة المتداولين في قراراتهم التداولية.
منتجاتي الأخرى:
https://ctrader.com/products/346
https://ctrader.com/products/336
https://ctrader.com/products/343
https://ctrader.com/products/347
https://ctrader.com/products/147
الملخص
The indicator consolidates three types of support and resistance levels into a single tool, allowing users to plot supply and demand zones with customizable settings such as period value, timeframe, the number of extremum points (current plus past support/resistance points), and indicator name and color. This multi-timeframe approach helps traders identify levels that carry more weight when confirmed across different timeframes, enhancing the reliability of these levels for decision-making.
By visualizing these critical zones, the indicator aids in anticipating potential price reversals or breakout opportunities. It supports a broader market overview, enabling more informed trading strategies based on the interaction of price with established support and resistance across various time horizons.
تقييمات العملاء
5 | 33 % | |
4 | 67 % | |
3 | 0 % | |
2 | 0 % | |
1 | 0 % |
![شعار "[Fx4U] GBPUSD - Price Action"](https://cdn.ctrader.com/image/webp/d80b34fc-da3c-4f01-a321-456450665649_26190)

![شعار "[Fx4U] CADJPY - Price Action"](https://cdn.ctrader.com/image/webp/1ba81247-b6b7-4f3c-a297-fa3eb1d57fe1_26195)

![شعار "[Fx4U] AUDCHF - Price Action"](https://cdn.ctrader.com/image/webp/0a22e9aa-c83b-42cd-b0b8-c1a2da593207_26148)

![شعار "[Fx4U] EURAUD - Price Action"](https://cdn.ctrader.com/image/webp/baf8dde4-1ef3-4beb-8ae2-0fed8320f65d_26177)


![شعار "[Hamster-Coder] Moving Average MTF"](https://cdn.ctrader.com/image/webp/b11b98b1-194d-4b8e-b00e-d611826ad159_31226)


