
الوصف
https://chartshots.spotware.com/c/695be69b1a3ca
https://chartshots.spotware.com/c/695be2a98e848
https://chartshots.spotware.com/c/695be7e8e88fa
https://chartshots.spotware.com/c/695be31346fe7
https://chartshots.spotware.com/c/695be3bd18aea
https://chartshots.spotware.com/c/695be5d5687c7
أنماط المخططات التلقائية
📊 ما هو؟
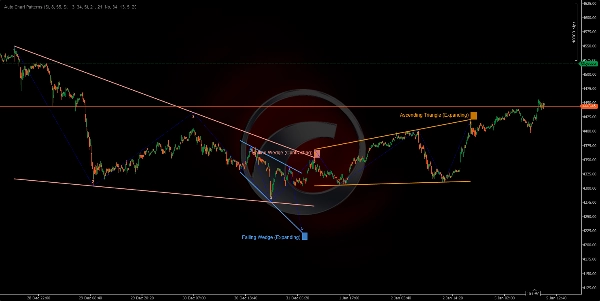
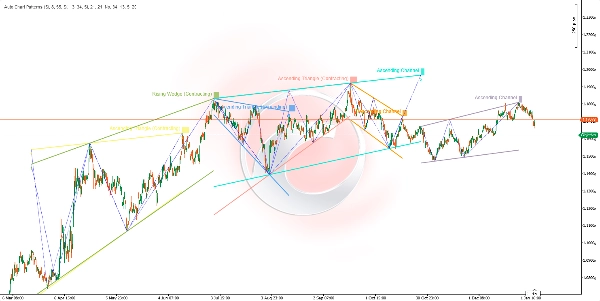
مؤشر أنماط المخططات التلقائية هو ماسح متقدم للتشكيلات الهندسية يكتشف تلقائيًا ويصور أنماط المخططات الكلاسيكية باستخدام تحليل نقاط التأرجح متعددة الأطر الزمنية. يحدد 14 تشكيلًا هندسيًا مختلفًا بما في ذلك القنوات، الأوتاد، والمثلثات عن طريق ربط قمم وقيعان التأرجح بخطوط الاتجاه، مما يخلق نظامًا شاملاً للتعرف على الأنماط.
🎯 ما الغرض منه؟
يساعد هذا المؤشر المتداولين على:
- الكشف التلقائي عن 14 نمط مخطط كلاسيكي (القنوات، الأوتاد، المثلثات) 📐
- تحديد مناطق الاختراق المحتملة قبل حدوثها ⚡
- تصوير هيكل السوق من خلال العلاقات السعرية الهندسية 🔍
- التداول على أنماط الاستمرار والانعكاس مع تأكيد بصري ✅
- تصفية الأنماط حسب اتجاه الاتجاه ونوع المحور النهائي 🎛️
- تحليل عدة أطر زمنية للتأرجح في نفس الوقت للتوافق 🌊
🔍 كيف يعمل؟
نظام اكتشاف نقاط التأرجح 📍
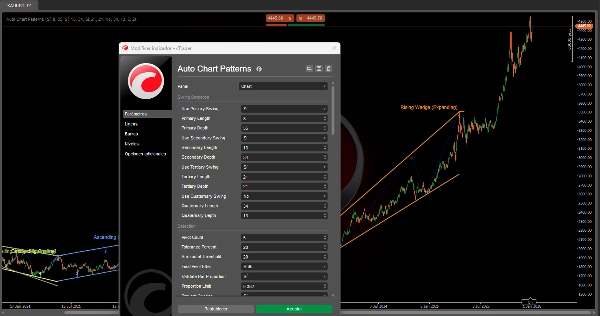
يستخدم المؤشر ما يصل إلى أربعة كاشفات تأرجح مستقلة تعمل في نفس الوقت، كل منها بحساسية قابلة للتكوين:
- منطق الكشف:
-
- يراقب أعلى وأدنى الأسعار خلال نافذة متحركة (الفترة).
- يحدد القمم المحلية (قمم التأرجح) والقيعان (قيعان التأرجح).
- يؤكد التأرجحات فقط بعد استيفاء متطلبات العمق الأدنى (يمنع الضوضاء).
- قمة التأرجح: السعر يصل إلى أعلى قمة في الفترة، ثم ينخفض لمدة
MinDepthشموع. - قاع التأرجح: السعر يصل إلى أدنى قاع في الفترة، ثم يرتفع لمدة
MinDepthشموع.
- أربعة طبقات تأرجح:
-
- التأرجح الأساسي (الافتراضي: الطول 8، العمق 55) - الهيكل طويل الأمد 🔵
- التأرجح الثانوي (الافتراضي: الطول 13، العمق 34) - الهيكل متوسط الأمد 🟢
- التأرجح الثالثي (الافتراضي: الطول 21، العمق 21) - الهيكل قصير الأمد 🟡
- التأرجح الرباعي (الافتراضي: معطل) - إطار زمني مخصص 🟣
يمكن تمكين/تعطيل كل كاشف بشكل مستقل للتركيز على هياكل سوق معينة.
عملية تشكيل الأنماط 🎨
الخطوة 1 - جمع المحاور:
- يجمع النظام 5 أو 6 نقاط تأرجح حديثة من أي كاشف نشط.
- يجب أن تتناوب النقاط بين القمم والقيعان (هيكل متعرج).
- مثال على 5 نقاط: قمة → قاع → قمة → قاع → قمة.
الخطوة 2 - بناء خطوط الاتجاه:
- يفصل المحاور إلى نقاط علوية (قمم التأرجح) ونقاط سفلية (قيعان التأرجح).
- يرسم خطي اتجاه: الحد العلوي والحد السفلي.
- لحدود 3 نقاط: يختبر 3 تركيبات (0-2، 0-1، 1-2) ويختار الأنسب ⭐
- يتحقق من أن خطوط الاتجاه لا تخترق أجسام الشموع (يسمح فقط بالفتائل).
- يحسب درجة الملاءمة: يجب أن تلمس الخطوط أقل من 20% من الشموع بين المحاور.
الخطوة 3 - التحليل الهندسي:
- يقيس العلاقة الزاوية بين الحدود العلوية والسفلية.
- يحدد ما إذا كان التشكيل متوسعًا (يتسع)، متعاقدًا (ينكمش)، أو متوازيًا (عرض ثابت).
- يحدد اتجاه الاتجاه: صاعد، هابط، أو محايد (أفقي).
- يصنف إلى واحد من 14 نوعًا من التشكيلات استنادًا إلى الهندسة.
الخطوة 4 - التحقق والتصفية:
- فحص نسبة الشموع: يضمن تناسب تباعد التأرجحات (يمنع التشوه في الأنماط) ✅
- منع التداخل: يمنع الأنماط الجديدة التي تتعارض مع الأنماط القائمة 🚫
- فحص التكرار: يمنع إعادة رسم نفس النمط.
- تصفية المحور النهائي: يعرض فقط الأنماط التي تنتهي باتجاه محور محدد (صاعد/هابط/كلاهما).
- تصفية نوع التشكيل: يمكن تفعيل/تعطيل فئات الأنماط المحددة.
الخطوة 5 - التصور:
- يرسم خطوط الحدود العلوية والسفلية بألوان زاهية من لوحة ألوان مكونة من 12 لونًا 🎨
- يعرض اختياريًا خطوط التأرجح المتعرجة التي تربط المحاور (زرقاء منقطة).
- يعرض أرقام المحاور (1، 2، 3، 4، 5) عند كل نقطة تأرجح.
- يضع تسمية للتشكيل باسم النمط عند المحور النهائي.
- يرمز لون الخلفية خلف التسمية للوضوح.
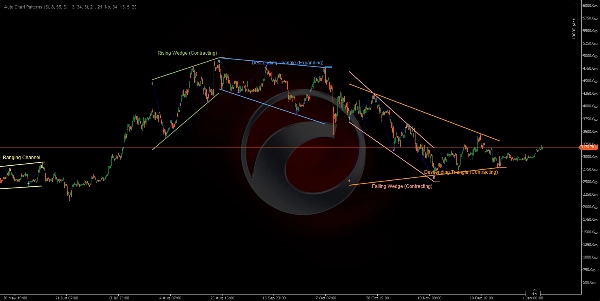
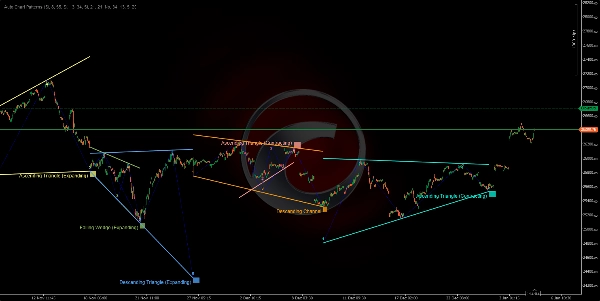
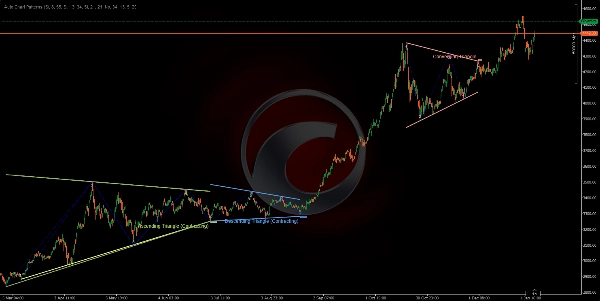
📐 الـ 14 تشكيلًا المكتشفة
القنوات (تشكيلات متوازية) 📦
- القناة الصاعدة (متوازية صاعدة) 📈
-
- كلا الحدين يميلان للأعلى بزاوية متشابهة.
- يشير إلى اتجاه استمرار صاعد.
- التداول: شراء عند الحد السفلي، بيع عند الحد العلوي.
- القناة الهابطة (متوازية هابطة) 📉
-
- كلا الحدين يميلان للأسفل بزاوية متشابهة.
- يشير إلى اتجاه استمرار هابط.
- التداول: بيع عند الحد العلوي، شراء عند الحد السفلي.
- القناة الجانبية (جانبية/أفقية) ↔️
-
- كلا الحدين شبه أفقيين.
- يشير إلى التماسك أو التردد.
- التداول: استراتيجية ضمن النطاق، شراء عند الدعم/بيع عند المقاومة.
الأوتاد المتوسعة (تشكيلات متسعة) 📣
4. الوِتد الصاعد (متوسع) ⚠️
* كلا الحدين يميلان للأعلى، مع اتساع الفجوة.
* نمط انعكاس هابط - السعر يفقد الزخم الصاعد.
* التداول: انتظر كسر الحد السفلي، ادخل صفقة بيع.
5. الوِتد الهابط (متوسع) ⚠️
* كلا الحدين يميلان للأسفل، مع اتساع الفجوة.
* نمط انعكاس صاعد - السعر يفقد الزخم الهابط.
* التداول: انتظر كسر الحد العلوي، ادخل صفقة شراء.
6. المثلث المتباعد (مثلث متسع) 🔺
* الحد العلوي يميل للأعلى، الحد السفلي يميل للأسفل.
* نمط توسع عالي التقلب.
* التداول: مخاطرة عالية جدًا، انتظر كسر اتجاهي واضح.
7. المثلث الصاعد (متوسع) 📊
* الحد العلوي أفقي، الحد السفلي يميل للأعلى.
* استمرار صاعد مع نطاق متوسع.
* التداول: شراء عند اختراق الحد العلوي.
8. المثلث الهابط (متوسع) 📊
* الحد السفلي أفقي، الحد العلوي يميل للأسفل.
* استمرار هابط مع نطاق متوسع.
* التداول: بيع عند اختراق الحد السفلي.
الأوتاد المتعاقدة (تشكيلات متقاربة) 🔻
9. الوِتد الصاعد (متعاقد) 🔺
* كلا الحدين يميلان للأعلى، مع تضييق الفجوة.
* نمط انعكاس هابط - نفاد صاعد ⚠️
* التداول: بيع عند كسر الحد السفلي.
10. الوِتد الهابط (متعاقد) 🔻
* كلا الحدين يميلان للأسفل، مع تضييق الفجوة.
* نمط انعكاس صاعد - نفاد هابط ⚠️
* التداول: شراء عند كسر الحد العلوي.
المثلثات المتعاقدة (تشكيلات التماسك) △
11. المثلث المتقارب (مثلث متماثل) ⚖️
* الحد العلوي يميل للأسفل، الحد السفلي يميل للأعلى بمعدل مشابه.
* تماسك محايد - نمط استمرار.
* التداول: انتظر اتجاه الاختراق، وتداول وفقًا له.
12. المثلث الهابط (متعاقد) 📐
* الحد السفلي أفقي (دعم)، الحد العلوي يميل للأسفل.
* نمط استمرار هابط 🔴
* التداول: بيع عند كسر الدعم مع حجم تداول.
13. المثلث الصاعد (متعاقد) 📐
* الحد العلوي أفقي (مقاومة)، الحد السفلي يميل للأعلى.
* نمط استمرار صاعد 🟢
* التداول: شراء عند كسر المقاومة مع حجم تداول.
14. غير صالح/مجهول ❌
* أنماط لا تستوفي المعايير الهندسية.
* يتم تصفيتها تلقائيًا.
الملخص
Key functionalities include identifying potential breakout zones, visualizing market structure through geometric price relationships, and supporting trading of continuation and reversal patterns with visual confirmation. Users can filter detected patterns by trend direction, pivot type, and formation category. The indicator prevents overlapping and duplicate patterns to maintain clarity.
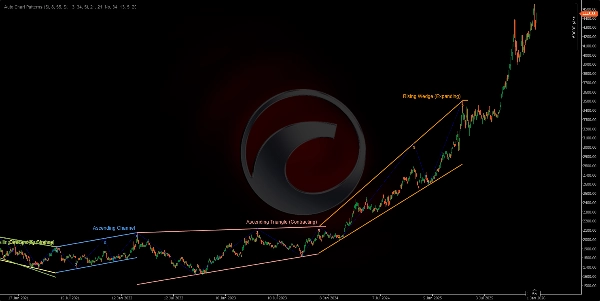
The 14 detected formations cover a range of classical patterns such as ascending, descending, and ranging channels; expanding and contracting wedges; and various triangle types (converging, diverging, ascending, descending). Visual outputs include color-coded boundary lines, pivot numbering, zigzag swing lines, and labeled pattern names for easy interpretation. This tool supports analysis across multiple markets including Forex, stocks, commodities, indices, and cryptocurrencies.
تقييمات العملاء
5 | 50 % | |
4 | 50 % | |
3 | 0 % | |
2 | 0 % | |
1 | 0 % |


